Options trading kills the dividend growth investing! That’s how I feel it is best summarized as to what happened in February.
No, I do not abandon the dividend growth strategy but it hit me hard. With the market uncertainty volatility going further up reaching its peak in recent weeks with the outbreak of the war between Russia and Ukraine, share prices plummeted, and so did my collateral against my options. At the same time option prices rose significantly for some of my open positions and margin requirements torpedoed my dividend investments.
In the end I had to draw the line and clear up a bit the mess to not jeopardize my dividend growth portfolio.
First, I cleaned up the option wheel mess with assigned stocks of Nano Dimensions (NNDM), Lordstown Motors (RIDE) and Palantir (PLTR). I sold all shares and closed the short call options.
Second, I reviewed my technology stock exposure which right now contributes little to my dividend income and sold Apple (APPL), Amazon (AMZN), Meta (FB), Microsoft (MSFT) and Visa (V). It hurts me to let them go because I consider these additional diversification for future dividend income. But I can always buy back in.
Third, I looked at some what I consider overvalued stocks and sold out of Broadcom (AVGO), General Dynamics (GD) and Netapp (NTAP).
That put me in a place to not worry anymore. The rebound on February 24th and 25th plus some options closures as per normal procedure put my exposure to a more acceptable level.
Obviously, I reviewed what went wrong and again found myself in having taken on too much risk. The key element that hits me with options trading is this. I have come up with a more conservative plan to limit my exposure to maximum 40% of my net asset value and drop to 25% if volatility (VIX) drops to below 15. In times of increased volatility which takes place in a more dynamic way on downward movements, my exposure will automatically go up and I would expect to about 50%-60% but that is what I can sleep with and gives me room to manage challenged positions.
With all of this my February dividend income still came in at $854.54 from a total of 18 companies.
On the bright side, I did open a new position with T. Rowe Price (TROW) at the beginning of February.
With all these impacts my Projected Annual Dividend Income (PADI) has dropped to below the 10K mark, at $9,789 at the end of February. The goal for this year is to reach $13,000 while having a cash neutral portfolio (no margin on cash). It looks like it is out of reach and I cannot count on so much options income. Safety first.
Dividend Income
It is time to review the earnings of my dividend growth strategy. Out of the companies I invest in 18 companies did pay me a dividend in February. I received $854.54 in total. This is truly passive income. Here are the details:
Apple (AAPL) – income of $4.40
AbbVie (ABBV) – income of $70.50
Bristol-Myers Squibb Co (BMY) – income of $108.00
Cornerstone Strategic Value Fund (CLM) – income of $36.16
CVS Health (CVS) – income of $22.00
Enterprise Products Partners L.P. (EPD) – income of $46.50
Energy Transfer (ET) – income of $35.00
General Dynamics (GD) – income of $59.50
General Mills (GIS) – income of $15.30
Gladstone Commercial Corp (GOOD) – income of $12.54
Highland Global Allocation Fund (ETF) (HGLB) – income of $24.30
KinderMorgan (KMI) – income of $13.50
Realty (O) – income of $14.79
Omega Health Care (OHI) – income of $67.00
Starbucks (SBUX) – income of $9.80
Tanger Factory Outlet Centers (SKT) – income of $18.25
AT&T (T) – income of $130.00
Unum Group (UNM) – income of $135.00
Verizon (VZ) – income of $32.00
Unum Group (UNM) and AT&T (T) are my main contributors with $135 and $130 respectively. With my additions to Bristol-Myers (BMY) the dividend income has also risen to three digits. Verizon (VZ) is back in my portfolio and has started to contribute to my dividend income.
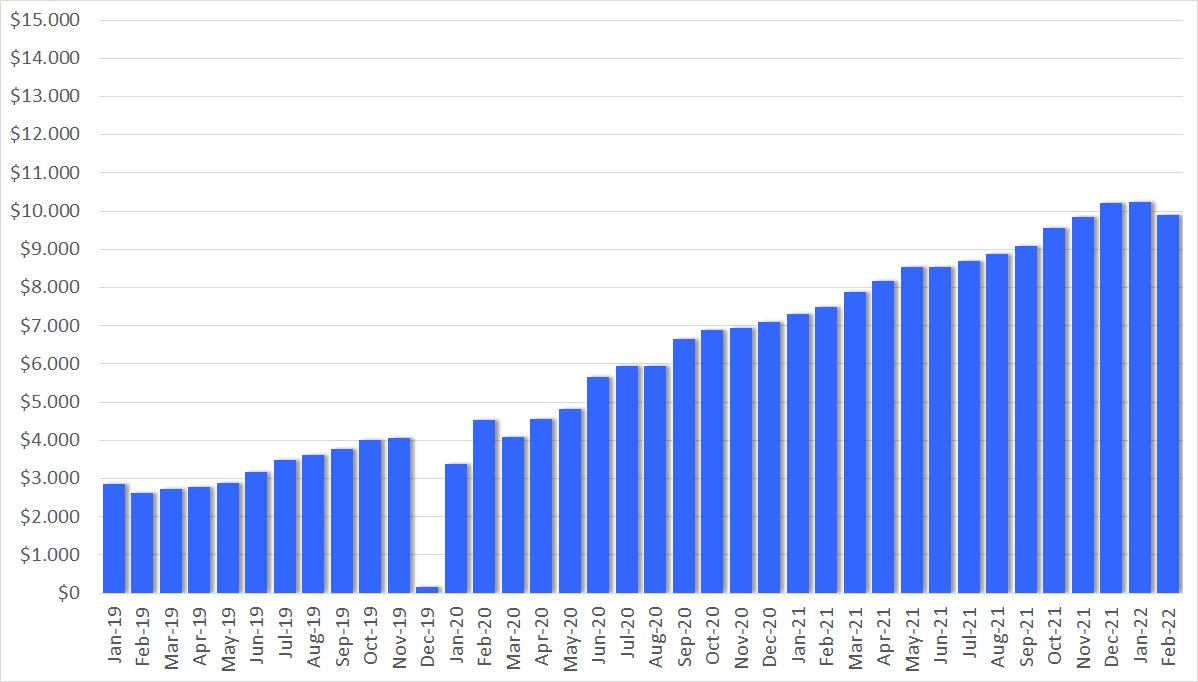
Overall, I like the way the dividend income looks and the chart confirms that I am going in the right direction.
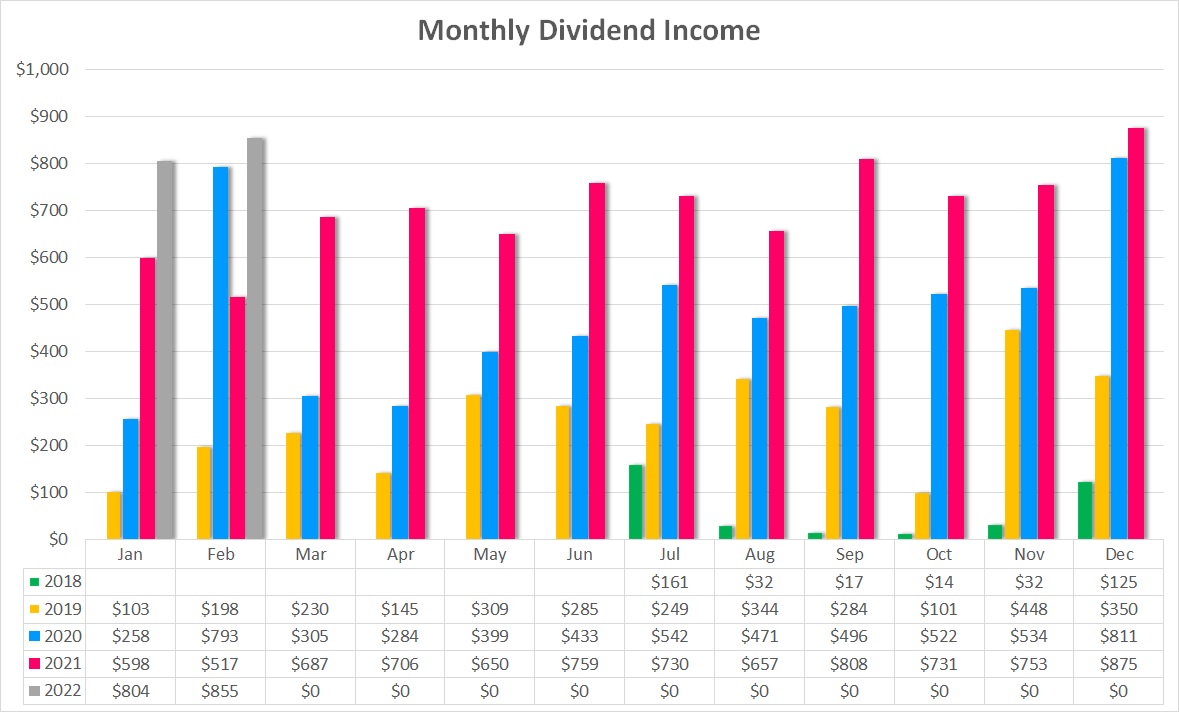
The above chart shows my monthly dividend income over time. In February 2022 I received $854.54 compared to February 2021 with $516.53 of income. This is an increase of $338.01 or 65%.
During 2021 I had increased my position in BMY and OHI as well as opened new positions with VZ. Dividend raises played their part, too.
Check out my current Dividend Income table for 2022 and the full overview of all the stocks. You can find there all the historical tables since 2019.
Dividend Changes
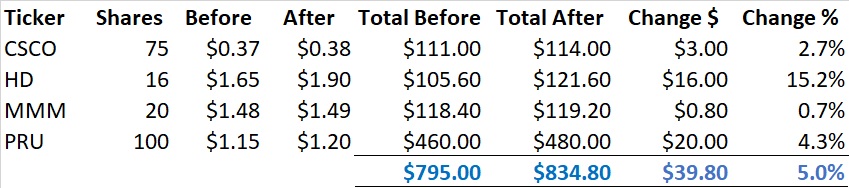
In February there have been in total four dividend increases in my portfolio. The table below summarizes the total impact of $39.80, with a weighted average increase of 5.0%.
This is exactly what I am looking for as a dividend growth investor. Trying to beat inflation is a key element of dividend growth investing. With an inflation rate north of 6% I am running a bit short this month.
As a result of this change, my PADI increased by $39.80. At a yield of 3.0%, to achieve this dividend income I would have to deploy $1,326 of my hard earned money. But this is not necessary. The dividend increases take care of it and that’s the beauty of dividend growth investing and the compound effect in action. Reinvesting these dividends makes the snowball grow larger and larger over time.
The Dividend Growth Portfolio
In the Dividend Growth Portfolio I hold 50 different companies. Here is an overview of the status as of February 28th. I sold out of a few positions and have liquidated the stocks that I are part of my wheel strategy on which I got assigned.
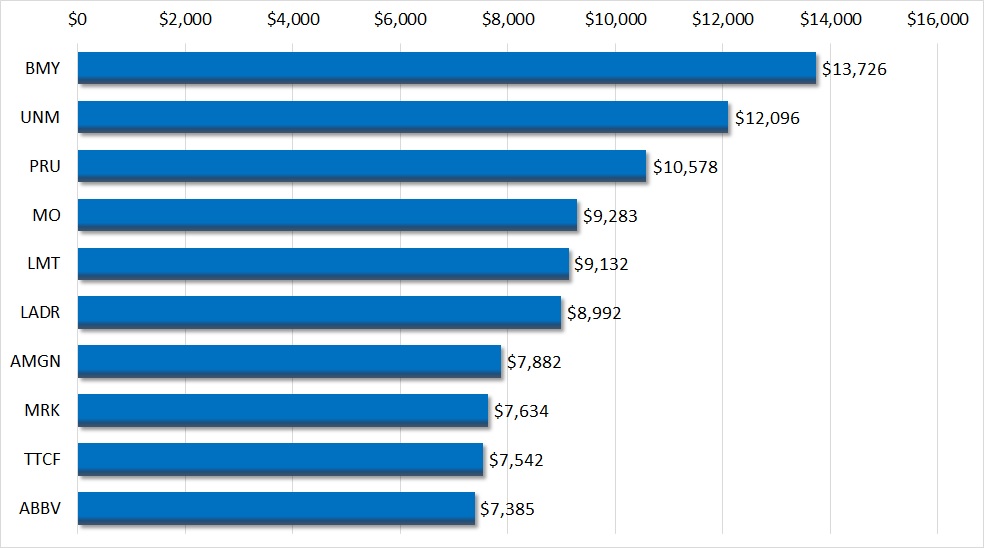
Here is the Top-10 holding overview. In total, these 10 stocks make up 39.6% of my dividend growth portfolio. BMY in the top spot weighs 5.76% of my portfolio value. ABBV as the number 10 still accounts for 3.10% of the portfolio value. GD has left the Top-10 as I sold my position.
Purchases
After the January massacre I felt that I was in a better position and considered investing again for dividend income. I decided to open a new position with T. Rowe Price (TROW) as the price of the shares had come down significantly.
Rowe Price Group (TROW)
Rowe Price provides asset-management services for individual and institutional investors. It offers a broad range of no-load U.S. and international stock, hybrid, bond, and money market funds. At the end of 2021, the firm had $1.688 trillion in managed assets, composed of equity (61%), balanced (29%), and fixed-income (10%) offerings. Approximately two thirds of the company’s managed assets are held in retirement-based accounts, which provides T. Rowe Price with a somewhat stickier client base than most of its peers. The firm also manages private accounts, provides retirement planning advice, and offers discount brokerage and trust services. The company is primarily a U.S.-based asset manager, deriving just under 10% of its AUM from overseas.
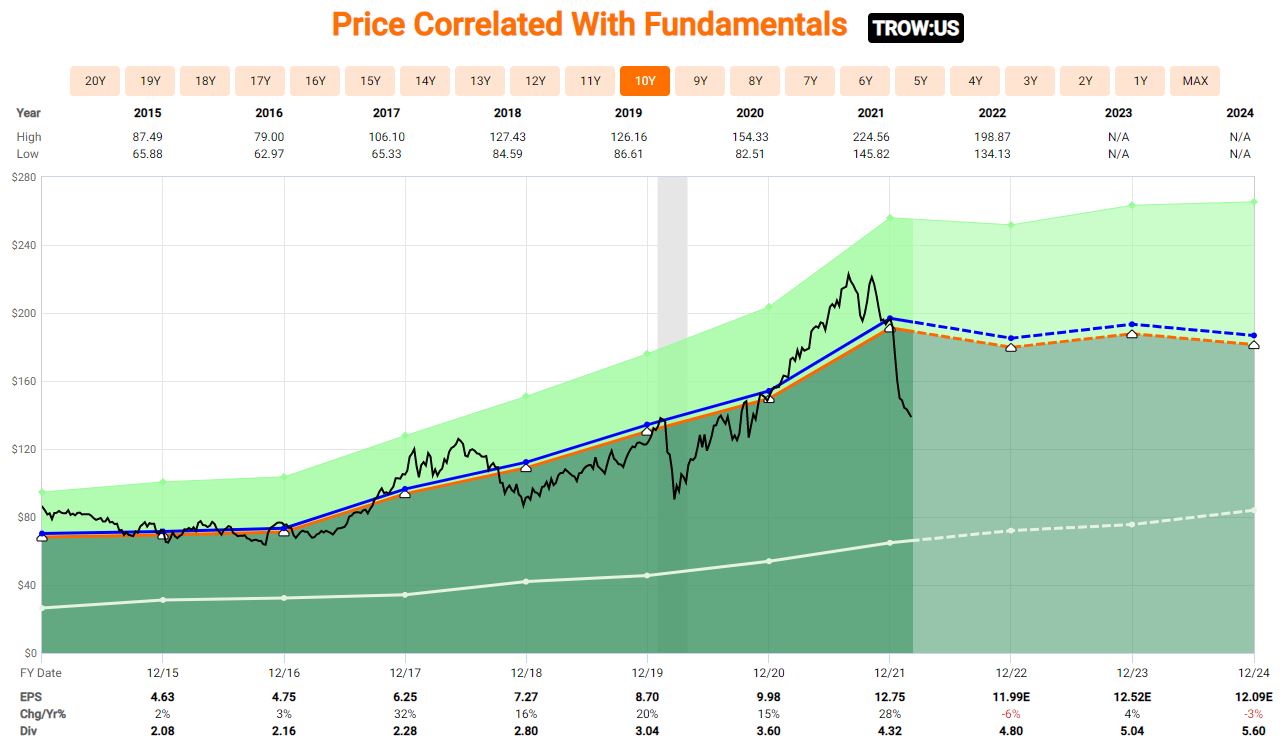
On February 10th I purchased 10 shares for a price of 1400.00 and on February 11th another 10 shares for 1400.00 which brings my average cost per share to $146.86. TROW offers good starting yield of 3.27% with a payout ratio of only 34%. I added to my PADI $96 of annual income.
Sales
As already mentioned in the introduction of this post February required a clean-up of my portfolio. Unfortunately, the continuous drop in the markets and my open options positions left me with not sufficient margin. I made the decision to sell certain positions, most of them I consider that they are not detrimental to my dividend growth investing strategy.
There have been 12 sales in February. Four of those positions were dividend stocks with a certain impact on my dividend income: AVGO, GD, NTAP and PPL. Three were low dividend payers but with high dividend growth rates: AAPL, MSFT and V. Another two stocks were pure growth investments: AMZN and FB. Finally, the remaining three sold positions were related to my options wheel strategy: NNDM, PLTR and RIDE.
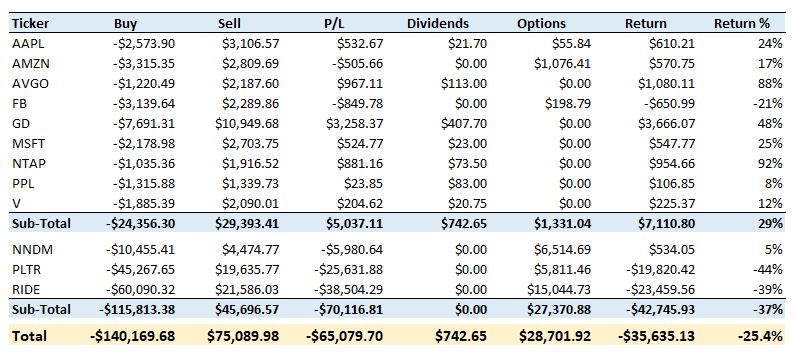
Here is an overview of these transactions and the returns for each of them. My dividend portion generated a return of $7,111 or 29% on just over $24k invested including price appreciation, dividends and some options income. The options wheel assignments did generate a significant loss which was not compensated by the options income: -$42,746 or -37% on an investment of $116k for the underlying shares.
In total, I took a loss of -$35,635 or -25% mainly due to the options wheel strategy that I had started in June 2021. Yes, this is a realized loss.
Check out my current Dividend Growth Portfolio and the full overview of all the stocks I hold in it.
Dividend Safety
One of the key metrics for my future passive income is how safe it is. For this reason I track my portfolio average Dividend Safety Score. For this score I use the weighted dividend safety punctuation from Simply Save Dividends combined with the dividend income of each of my stocks. The higher the score the safer the dividend income.
Dividend Safety Score
For February, the Dividend Safety Score dropped to below 60 and ended up at 59.2 for my dividend growth portfolio, a change of -0.8 points compared to January.
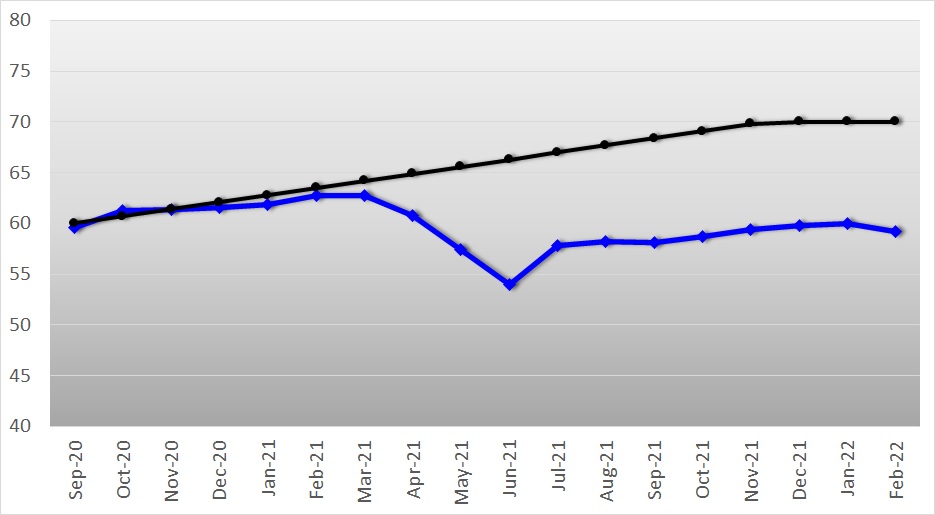
This decrease is due to the sale of companies mostly with a dividend safety score well above my current average, in particular GD has a significant impact due to its size.
I consider the score of below 60 as not acceptable end and my target is a score of 70. So, as of now I am below my minimum acceptable value. My goal for 2022 is to bring the score to 65 points. It will be a difficult target to achieve, but only quality prevails.
For that reason, I will keep focusing on adding high quality stocks for the foreseeable future. My plan is not to sell low rated stocks but instead re-balance to high scoring ones when deploying more money. The overall target of an average score of 70 remains but it will take potentially several years to get to that level.
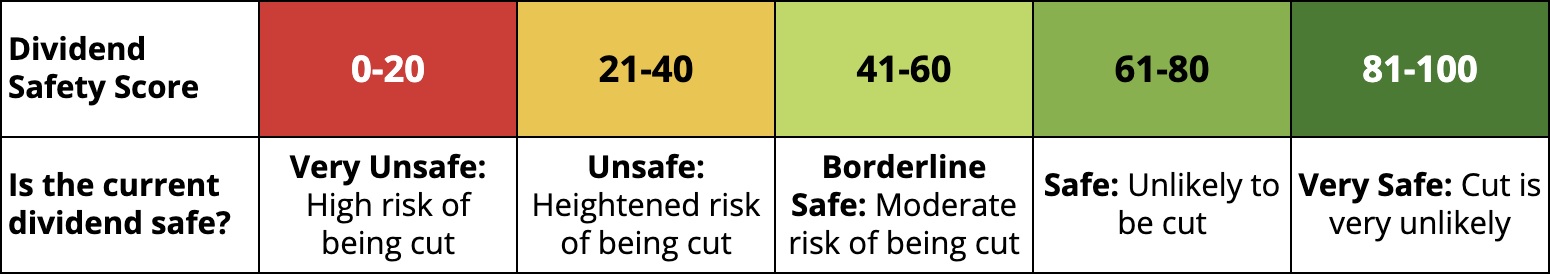
Let’s look at the actual distribution. I use the same classification as Simply Safe Dividends as it makes it easy to spot the categories. You see that I also created an unclassified category.
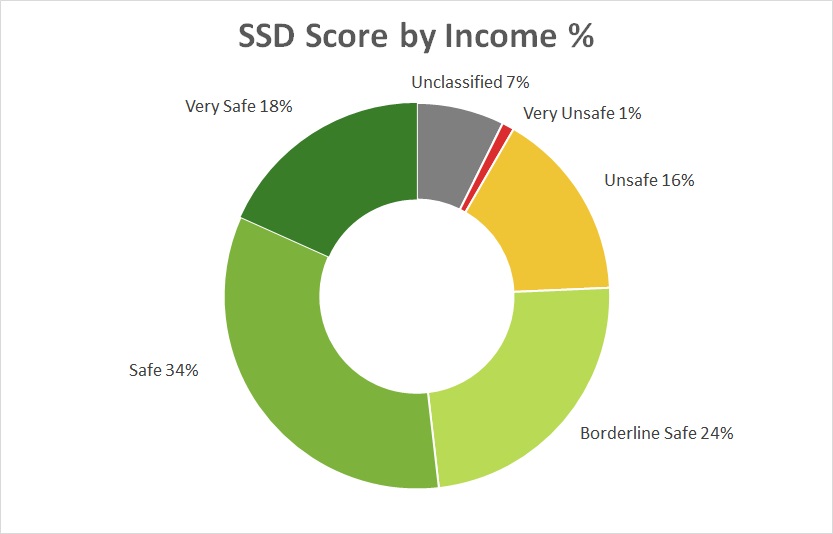
The different categories and their respective score ranges from very unsafe to very safe are:
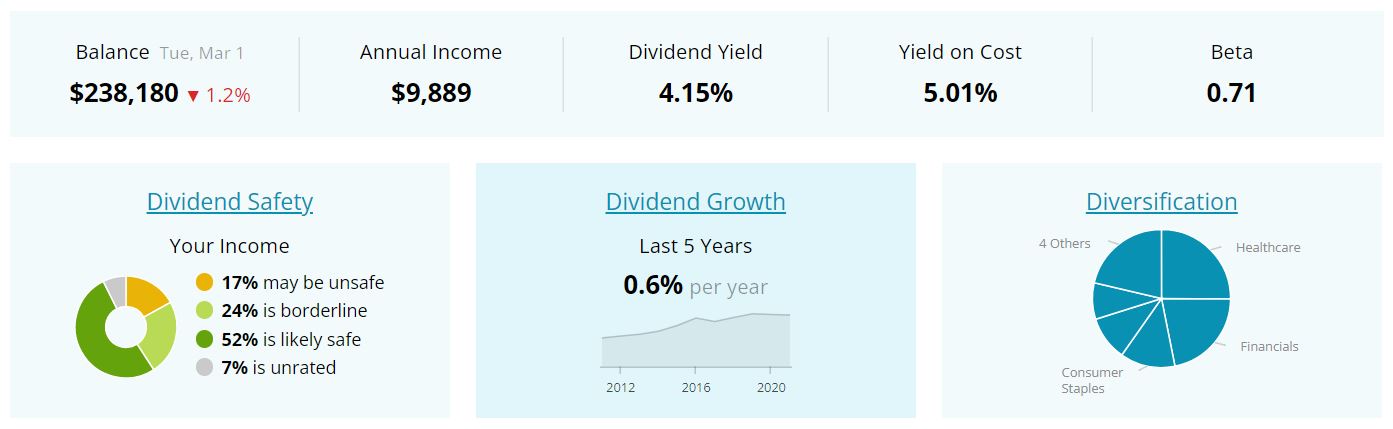
In my portfolio now more than half or 52% of my portfolio is in the Safe and Very Safe category which has very little risk of being cut. Another 24% is Borderline Safe. The remaining 17% are Unsafe or Very Unsafe. 7% are unclassified and have a score of zero. I need to monitor especially the unsafe positions closely.
In February, there was a shift from Very Safe to Safe and Borderline Safe related to the sale of the high-quality stocks GD, APPL, MSFT and V. As a result, the percentage of Very Safe dropped from 21% to 18%, Safe and Borderline Safe increased from 32% to 34% and from 23% to 24% respectively.
Dividend Safety Score Stock by Stock
For each individual stock in my portfolio the current score is as follows:
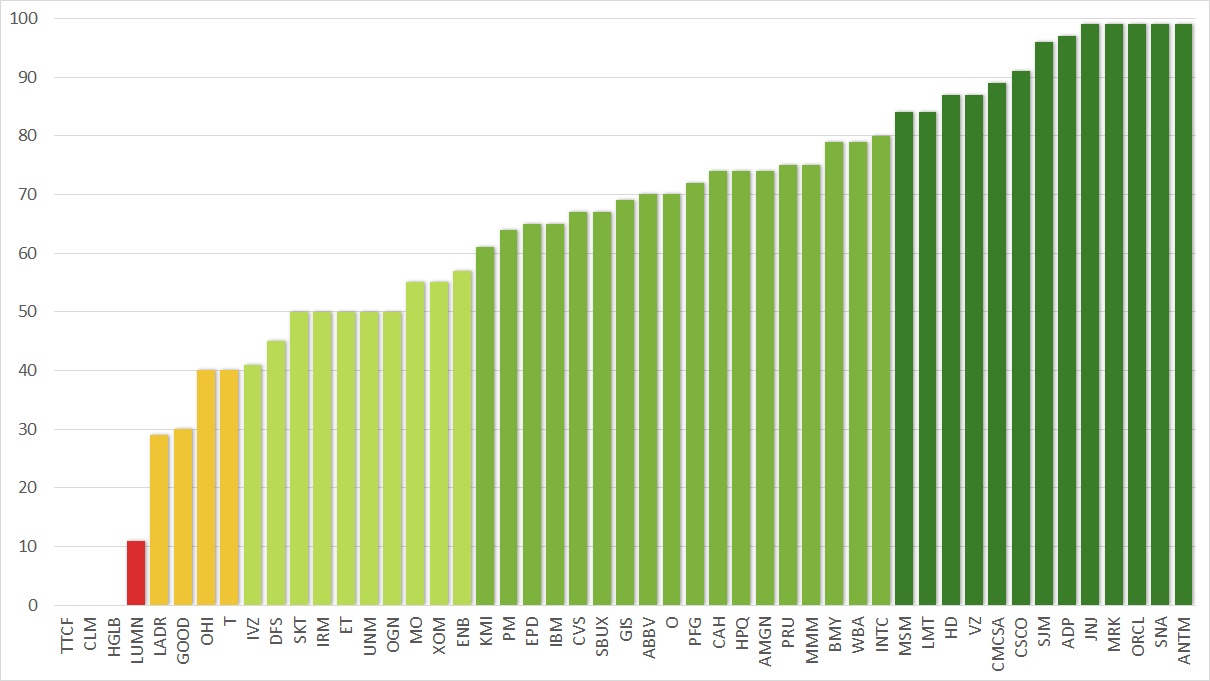
I hold now 13 companies in the highest category of Very Safe, of which 5 actually have the highest score of 99. Another 18 companies are in the second highest category Safe. Overall, my portfolio contains many high-quality dividend stocks with a safe dividend score.
AT&T (T) announced a dividend cut by 47%, going from $2.08 to $1.11 annually. This is related to the now spin-off in which all AT&T investors will receive a 0.24 share of the new media company – Warner Bros. Discovery (WBD) – for each AT&T share. However, Simply Safe Dividends still has kept a score of 40 for T.
On the other end we see the red alarming light with LUMN (formerly CTL). It is only a small position and I am not concerned about this one.
LADR as it is my largest position for dividend income and as such gives me the most exposure to a potential dividend cut. PPL is smaller positions and has a risk of a dividend cut. My sell order is placed as mentioned before.
AT&T (T) remains in the portfolio for now. The future spin-off setup is now out and with dates of the transaction. AT&T investors will receive about 0.24 share of the new media company – Warner Bros. Discovery (WBD) – for each AT&T share once the deal closes. At the same time, it is confirmed that AT&T’s post-close annual dividend per share to be $1.11 or $0.2775 quarterly, down 47% from the current payout of $2.08 per share.
Dividend Safety of Income Distribution
When combining the dividend safety score with the income the picture looks as follows:
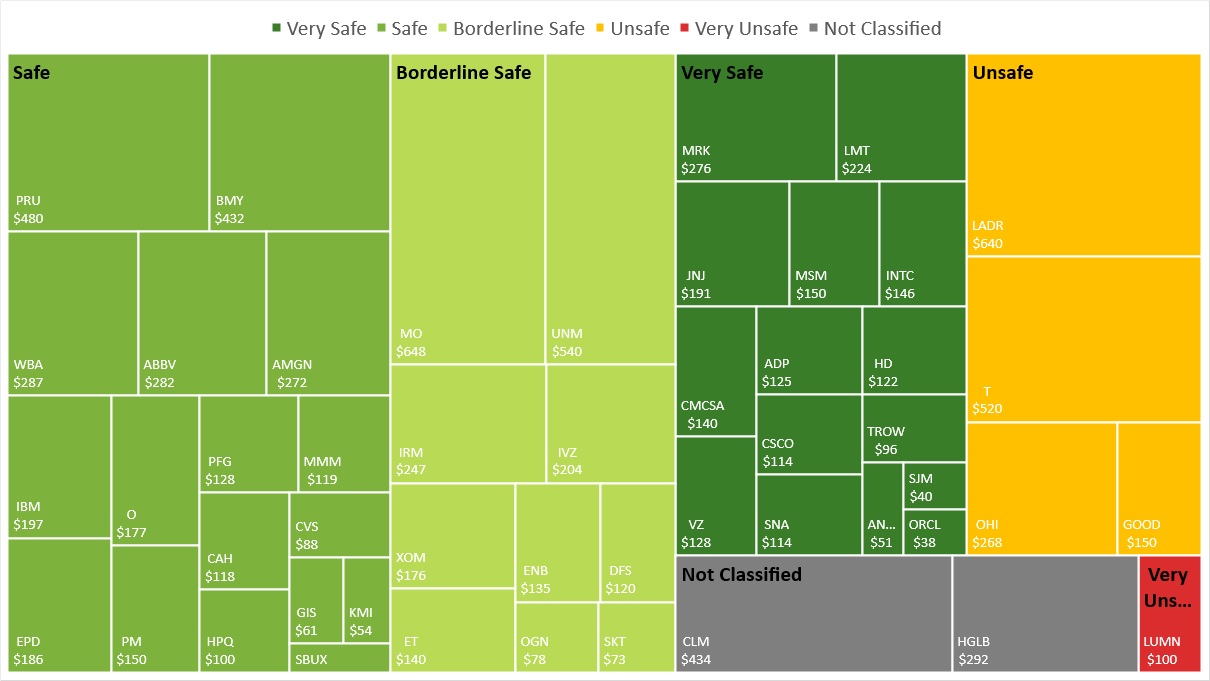
You can see that the largest group is the Safe category, followed by the Borderline Safe one. Unfortunately, the Very Safe category has taken a hit and has shrunk quite a bit. However, I will focus on bringing it back to and even get to the biggest portion of my portfolio. I am still very happy with the overall picture.
With T and LADR having in the Unsafe category, its size is substantial. I will sit the AT&T spin-off out but already diversified into VZ at the end of 2021. The dividend cut by 47% is now planned. I have not considered it yet in my PADI as it is not officially the new payout as of end of February. LADR I bought at a very good time and would expect no mayor issues for now.
Dividend Safety and Yield
Another way of looking at the dividend safety is by yield and score. For each of my holdings I compare these values to visualize the figures which clearly lets you draw some general conclusions.
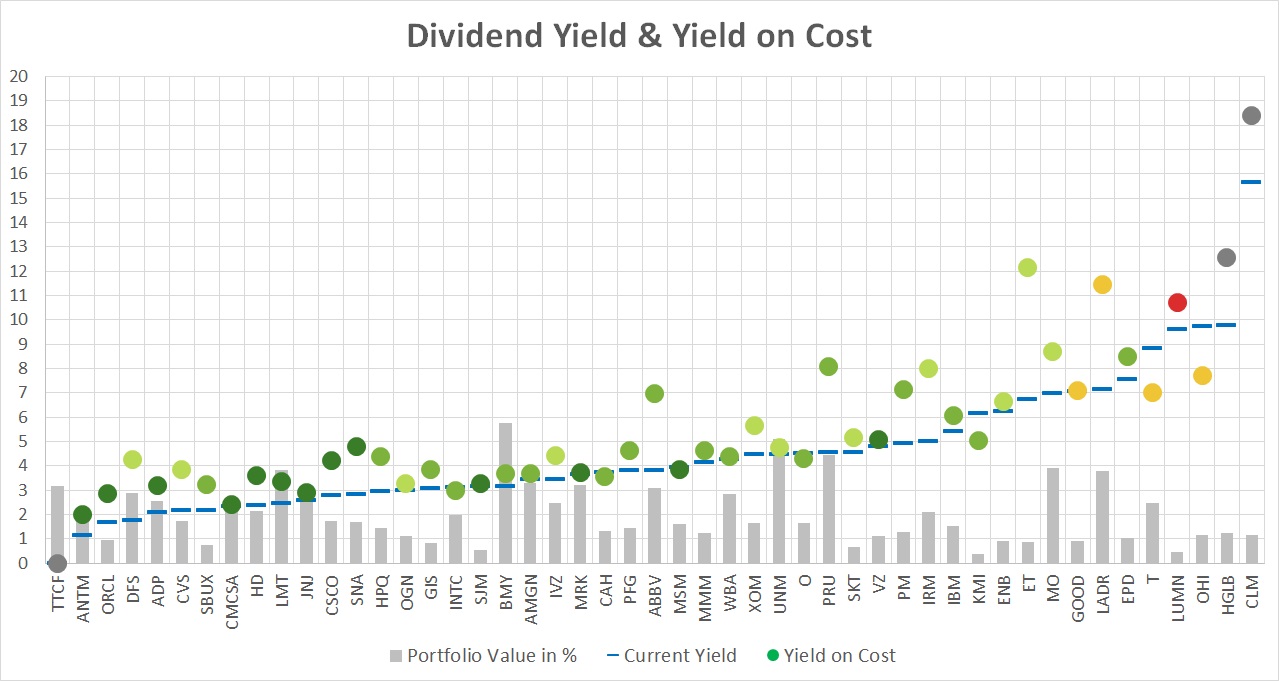
The dots represent my yield-on-cost with the color of the dividend safety score. The blue lines indicate the current yield of these stocks. The grey dots represent companies that either do not pay a dividend or are not covered by SSD. The light grey bars represent the percentage of the stock value in my portfolio.
There is a clear correlation between yield and safety score. On the left hand side (apart from the grey dots) we have the low yield, high safety score companies. The further we go to the right, the lower the dividend safety score becomes but it typically comes with a higher yield.
If the blue line (current yield) is below the dot (yield on cost) it means that either the stock has appreciated in price or the dividend was raised or both. Companies recovered quite nicely after the lows in March 2020 and most of my stocks have a lower current yield than my yield on cost.
On the left hand side you see the high quality stock with a high dividend safety score. They typically pay only a low to moderate dividend. However, most of them have relatively high dividend growth rates.
On the right hand side you can also see the extreme values that stocks can take on. CLM, HGLB, LUMN, ET and LADR have a yield on cost of above 10%. CLM after the raise for 2022 is even close to 20%. However, one of my goals going forward is not to chase the yield as we can so clearly see that it comes with a lot of risk. Still, if I see an opportunity I am open to explore it.
Over time, I would like to see the left zone to experience a push upwards of the dots as dividend increases impact on my yield-on-cost.
At the same time, my continuous adding to the positions typically increases the average cost and lowers the yield-on-cost.
Projected Annual Dividend Income (PADI)
My Projected Annual Dividend Income (PADI) decreased to $9,889 in February compared to $10,247 at the end of January. This is a drop of -$358 or -3.5%.
My target for 2022 was to reach $13,000 in forward looking annual dividend income. This meant on average I need to add $232 of income per month. January was already below this number and with the significant drop in February it will be a tough one to hit in 2022.
I will keep the target though and will push as hard as I can. My main contributor will be my options income without taking on too much risk. I got burned in March 2020 and hit again in February 2022. But I have learned my lessons and have changed to a more conservative and risk adjusted strategy. Also, no more options wheel deals.
My journey continues to invest in high quality dividend growth stocks. I maintain myself firm to invest in undervalued stocks. I need to watch my options exposure and if markets drop it increases the opportunities to buy high-quality stocks at a lower price.
Portfolio Dividend Yield
The current yield of the shares in my portfolio is 4.15%, an increase of 0.39 compared to January. The stock market dropped to lower recent lows and I sold some low yielding stocks in my portfolio and this pushes the current yield up.
The investment yield for my dividend growth portfolio is 5.01%. For this yield I compare the current dividend income with the purchase price of the underlying shares. A small significant by 0.34 points since January. Again, this is related to having sold low yielding stocks in February.
My yield on cost (YoC) has dropped this month to 5.44% by 0.19 points, because of the net impact from selling my GD and other positions.
Conclusion
The dividend income for January was $854.54 from 18 different companies, a 65% increase compared to February last year. My PADI stands at $9,889. In order to hit my 2022 target I need to contribute more money or generate options income.
The dividend safety score of my portfolio is 59.2, an decrease of -0.8 points and still significantly below my set overall target of 70. For 2022 the target will be to reach a score of 65 points. My analysis has shown that 52% of my dividend income is categorized as safe, but there are still a few stocks with a high risk of being cut, and AT&T (T) has already announced that it will reduce its dividend by 47%.
The risk of haven option positions that are too big for a portfolio are real and can challenge and even change the course of the entire journey. I had to sell several positions to meet my margin requirements. At the same time, it helped me to establish more stricter rules on my options trading.
If you find the information provided helpful and inspiring, please consider subscribing to my email list and you will never miss another update. I am also happy to receive comments either on the stocks I hold or other views you want to express. Thank you for having taken the time to read this post.
Disclosure: At time of writing long on all above mentioned except those specifically mentioned to have closed the position
Disclaimer: I am not a professional investment or financial advisor. The information presented on this site represents my personal dividend growth journey and it is for informational purposes only. Opinions expressed are my own and should NOT be relied on or taken as investing advice. I have no knowledge about your personal situation and before you make any investment decision you should exercise due diligence and must do your own research. Always consider seeking advice from a professional financial and tax advisor.