Every month I take the time to review my portfolio and dividend income. However, with the Christmas time being a busy period I did not manage to post the November results earlier. So here we go.
In November I received $752.98 in dividends from a total of 18 companies. I like the way several companies pay me every month. Diversification for a dividend investor may be more important than for other investing strategies.
My Projected Annual Dividend Income (PADI) has increased to $9,834 in November. Another big step towards the 5-digit figure.
The wheel options strategy continues and November has been a great month. As you probably know I boost my income by trading the wheel. I sold puts on CWH, NIO, NNDM, PLTR, RIDE, RIVN and UNM. Additionally, I sold calls on INTC. My GAIN position was called away.
Dividend Income
It is time to review the earnings of my dividend growth strategy. This is truly passive income. My November Dividend Income in detail:
Apple (AAPL) – income of $4.40
AbbVie (ABBV) – income of $65.00
Bristol-Myers Squibb Co (BMY) – income of $49.00
Cornerstone Strategic Value Fund (CLM) – income of $32.04
CVS Health (CVS) – income of $20.00
Enterprise Products Partners L.P. (EPD) – income of $45.00
Energy Transfer (ET) – income of $30.50
General Dynamics (GD) – income of $59.50
General Mills (GIS) – income of $15.30
Gladstone Commercial Corp (GOOD) – income of $12.53
Highland Global Allocation Fund (ETF) (HGLB) – income of $21.30
KinderMorgan (KMI) – income of $13.50
MSC Industrial (MSM) – income of $37.50
Realty (O) – income of $14.16
Omega Health Care (OHI) – income of $40.20
Starbucks (SBUX) – income of $9.80
Tanger Factory Outlet Centers (SKT) – income of $18.25
AT&T (T) – income of $130.00
Unum Group (UNM) – income of $135.00
UNM and T are my main contributors with $135 and $130 respectively. They make up 35% of my income in November. BMY has grown quite a bit as I added consistently to the stock over the last months.
EPD is a new contributor this month. It is a high yielding stock and it entered with a noticeable level of $45 this month.
Overall, I like the way the dividend income looks and the chart confirms that I am going in the right direction.
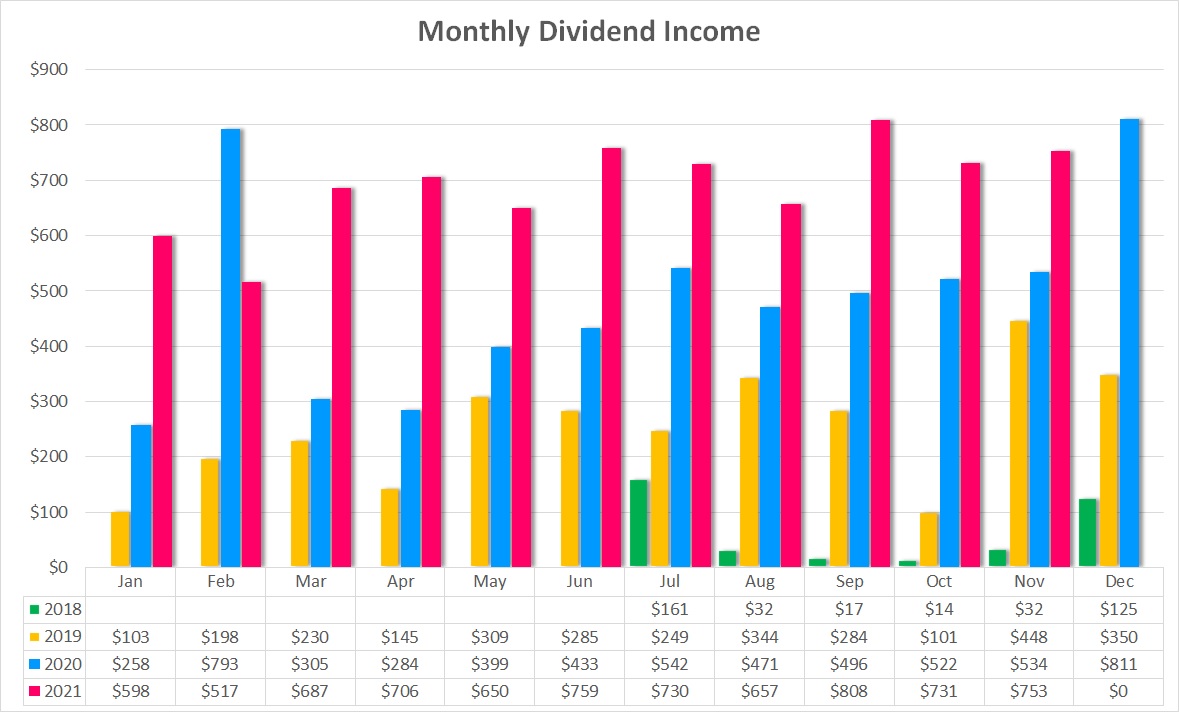
The above chart shows my monthly dividend income over time. In November 2021 I received $752.98 compared to November 2020 with $534.34 of income. This is an increase of $218.64 or 41%. This is an amazing growth rate and I will keep pushing myself to keep it up at such an high level.
Year over year I managed to increase my income from $5,035.08 in the period January to November 2020 to $7,595.52 in the same period in 2021. That is an increase of $2,560.44 or 51%.
Check out my current Dividend Income Table for 2021 and the full overview of all the stocks.
Dividend Changes
In November there have been quite a few dividend increases in my portfolio. The table below summarizes the total impact of $102.64, with a weighted average increase of 9.6%. It is the first time that the dividend increases surpassed the $100 mark in one month.
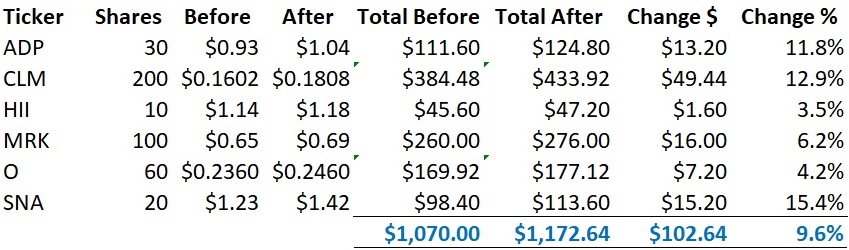
As a result of this change, my PADI increased by $102.64. At a yield of 3.0%, to achieve this dividend income I would have to deploy $3,421. But this is not necessary. The dividend increases take care of it and that’s the beauty of dividend growth investing and the compound effect in action.
The Dividend Growth Portfolio
In the Dividend Growth Portfolio I hold 60 different companies. Here is an overview of the status as of December 1st. I have excluded the stocks that I are part of my wheel strategy on which I got assigned.
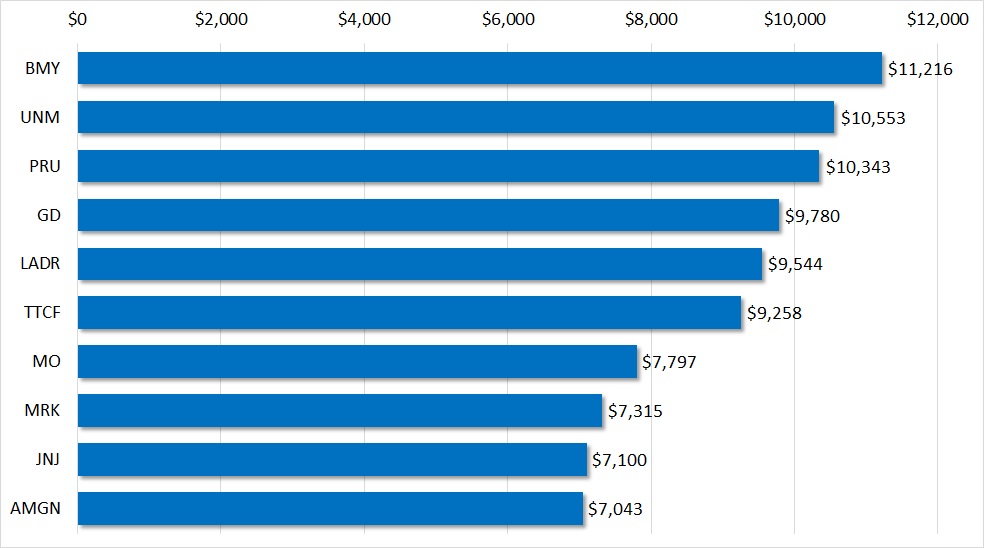
Here is the Top-10 holding overview. In total, these 10 stocks make up 35.2% of my dividend growth portfolio. BMY has jumped from 10th place to the top as I added significantly in November to the stock. It makes up 4.39% of my portfolio value.
IVZ and WBA have left the Top-10 again and JNJ and AMGN have replaced them. TTCF is a growth stock and does not pay any dividends.
To enter the Top-10 the position value needs to be at least $7,000 or 2.75% of my portfolio value.
Purchases
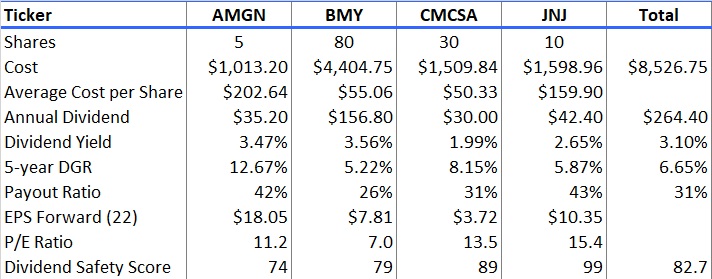
In November I added to four existing positions of high quality dividend growth stocks. I added further to AMGN which I started in September, BMY and JNJ as the price keeps coming down, and CMCSA when it dropped below $50. All of these stocks I consider undervalued and with a very good dividend safety score with an average of 82.7 points. The payout ratios are also on the lower end. The dividend 5-year CAGR is in the mid-range at 6.65%.
Amgen Inc (AMGN)
Amgen is a leader in biotechnology-based human therapeutics, with historical expertise in renal disease and cancer supportive-care products. Flagship drugs include red blood cell boosters Epogen and Aranesp, immune system boosters Neupogen and Neulasta, and Enbrel and Otezla for inflammatory diseases. Amgen introduced its first cancer therapeutic, Vectibix, in 2006 and markets bone-strengthening drug Prolia/Xgeva (approved 2010) and Evenity (2019). The acquisition of Onyx bolstered the firm’s therapeutic oncology portfolio with Nexavar and Kyprolis. Recent launches include Repatha (cholesterol-lowering), Aimovig (migraine), and Lumakras (lung cancer). Amgen’s biosimilar portfolio includes Mvasi (biosimilar Avastin), Kanjinti (biosimilar Herceptin), and Amgevita (biosimilar Humira).
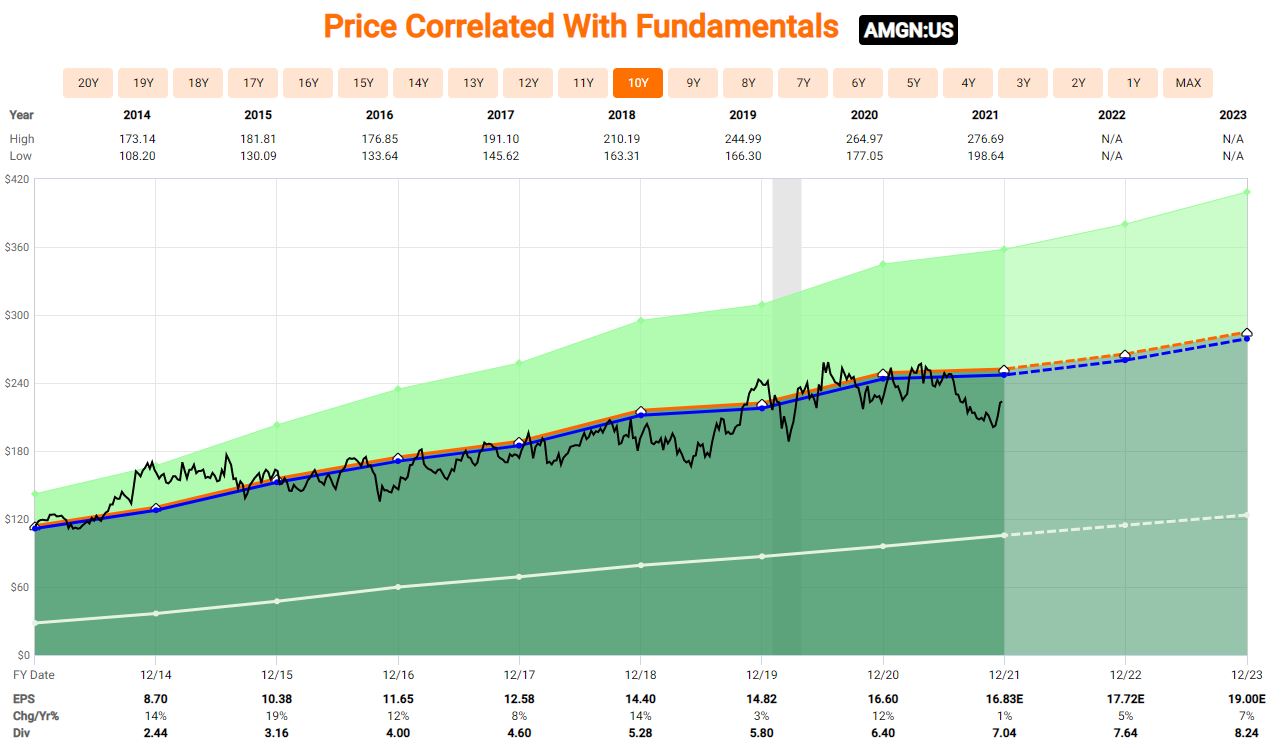
Source: FastGraphs
Bristol-Myers Squibb Co (BMY)
Bristol-Myers Squibb discovers, develops, and markets drugs for various therapeutic areas, such as cardiovascular, oncology, and immune disorders. A key focus for Bristol is immuno-oncology, where the firm is a leader in drug development. Unlike some of its more diversified peers, Bristol has exited several nonpharmaceutical businesses to focus on branded specialty drugs, which tend to support strong pricing power.
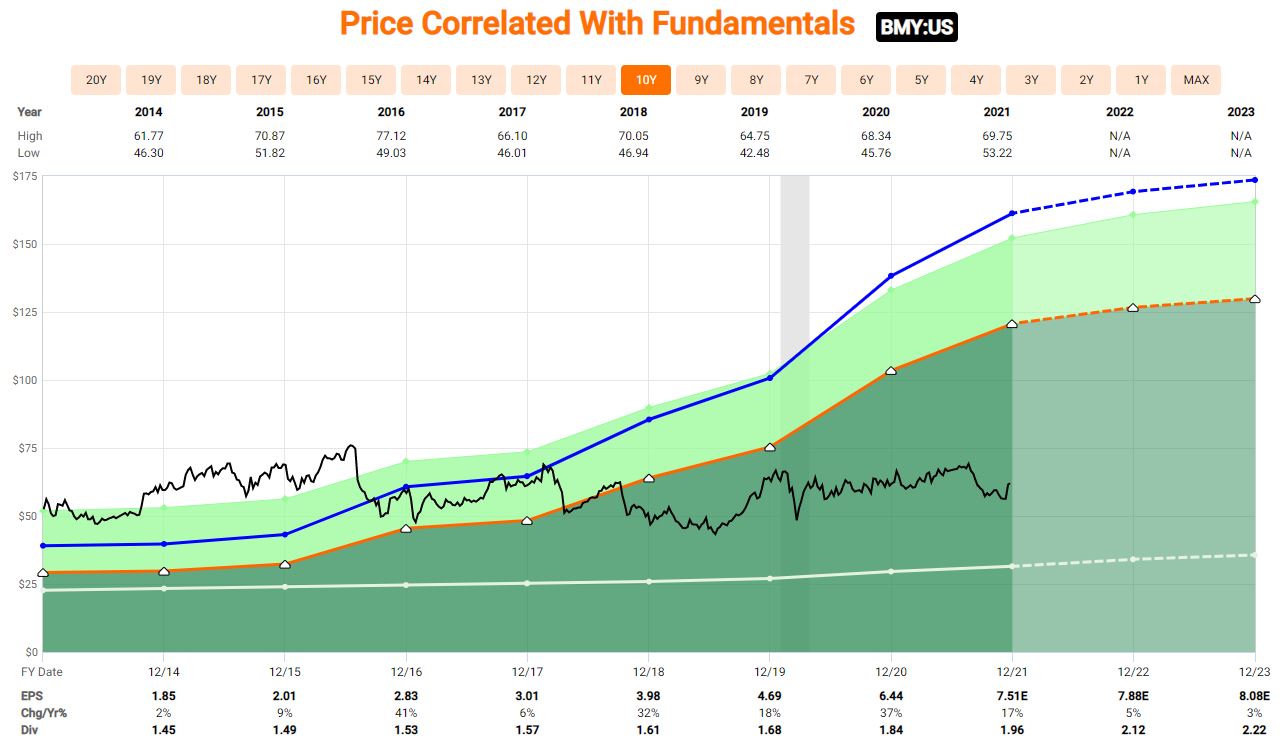
Source: FastGraphs
Comcast Inc. (CMCSA)
Comcast is a core cable business and network provider for television, Internet access, and phone services to roughly 60 million U.S. homes and businesses, or nearly half of the country. About 55% of the homes in this territory subscribe to at least one Comcast service. Comcast acquired NBC Universal from General Electric in 2011. NBCU owns several cable networks, including CNBC, MSNBC, and USA, the NBC broadcast network, several local NBC affiliates, Universal Studios, and several theme parks. Sky, acquired in 2018, is the dominant television provider in the U.K. and has invested heavily in exclusive and proprietary content to build this position. The firm is also the largest pay-television provider in Italy and has a presence in Germany and Austria.
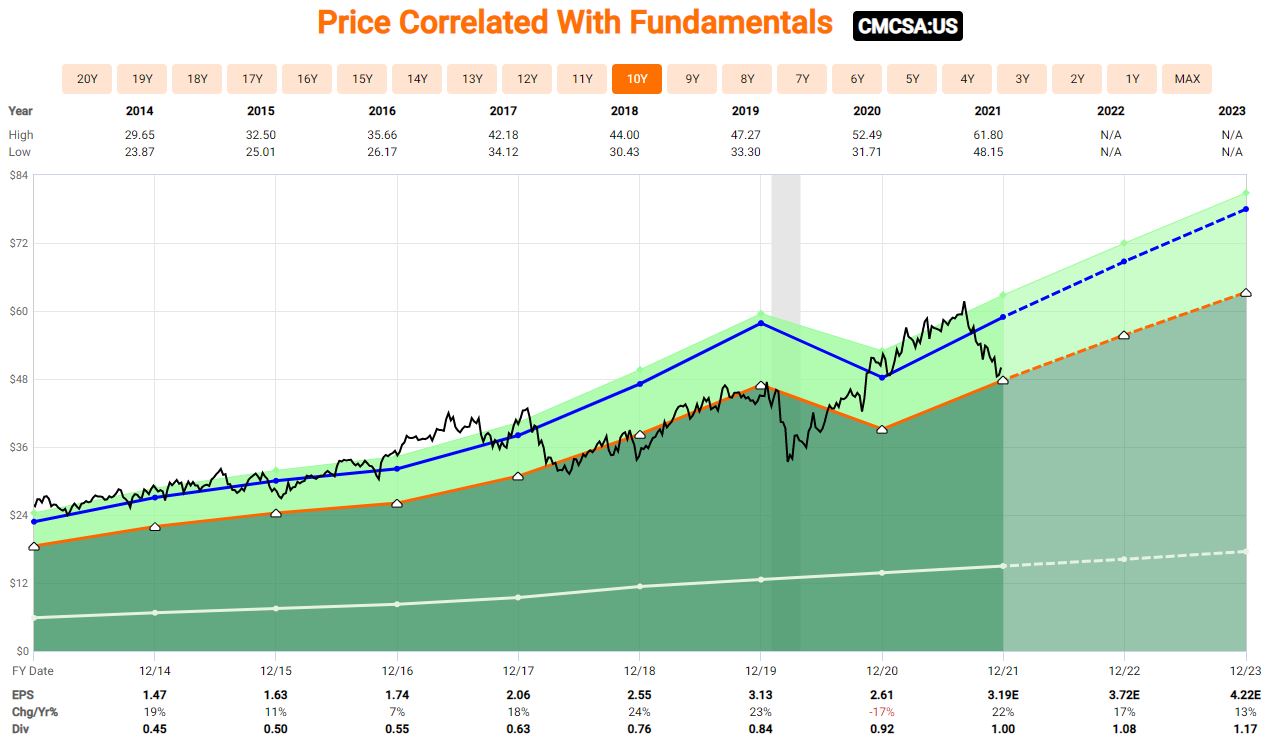
Source: FastGraphs
Johnson & Johnson (JNJ)
Johnson & Johnson is the world’s largest and most diverse healthcare firm. Three divisions make up the firm: pharmaceutical, medical devices and diagnostics, and consumer. The drug and device groups represent close to 80% of sales and drive the majority of cash flows for the firm. The drug division focuses on the following therapeutic areas: immunology, oncology, neurology, pulmonary, cardiology, and metabolic diseases. The device segment focuses on orthopedics, surgery tools, vision care, and a few smaller areas. The last segment of consumer focuses on baby care, beauty, oral care, over-the-counter drugs, and women’s health. Geographically, just over half of total sales are generated in the United States.
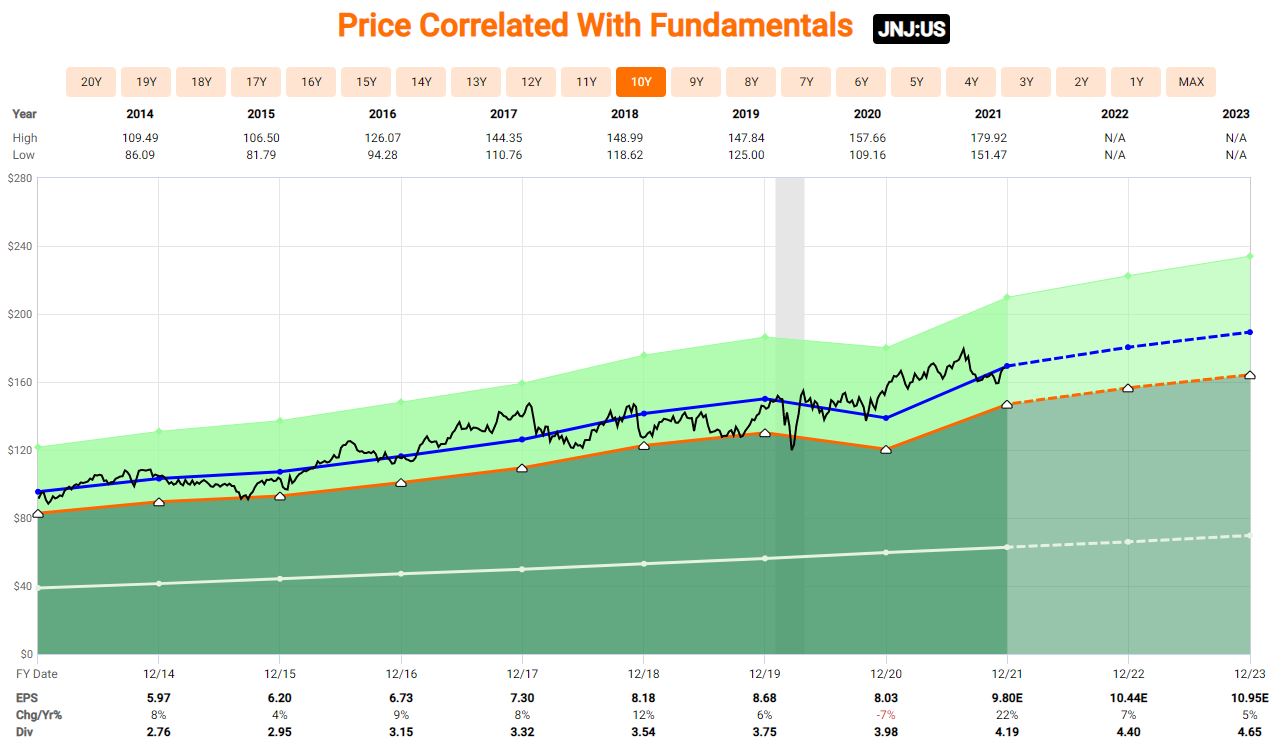
Source: FastGraphs
These are the companies I invested in during November. As a result, I have added $264.40 of dividend income to my Projected Annual Dividend Income (PADI). On an investment amount of $8,526.75 including fees it comes to an average dividend yield of 3.10%.
Sales
I had sold a call on my 100 shares of GAIN and got called just before the ex-dividend date in November. Hence, I sold my shares at the set strike price of the option.
Actually, GAIN was my first purchase with IBKR in December 2019. The share price then was $14.25 per share. I sold them now for $15.00 each. In the mean time I collected the monthly dividend of 0.070 cents per share plus the odd extra dividend. Unfortunately, I am not able to participate in the raised dividend to 0.075 cents per share. As a result, my PADI is reduced by $90 on an annual basis.
My open order to sell PPL has not yet been filled but we are getting close.
Additionally, I consider selling my full position in INTC which is 100 shares. I currently sell covered calls against it (right now with strike at $52 and expiration in early January) until they get called away.
Check out my current Dividend Growth Portfolio and the full overview of all the stocks I hold in it. You can see now two sections: the dividend portfolio and the holdings on stock option wheel trading.
Dividend Safety
One of the key metrics for my future passive income is how safe it is. For this reason I track my portfolio average Dividend Safety Score. For this score I use the weighted dividend safety punctuation from Simply Save Dividends combined with the dividend income of each of my stocks. The higher the score the safer the dividend income.
Dividend Safety Score
For November, the Dividend Safety Score increased to 59.4 for my dividend growth portfolio, a change of 0.7 points compared to October.
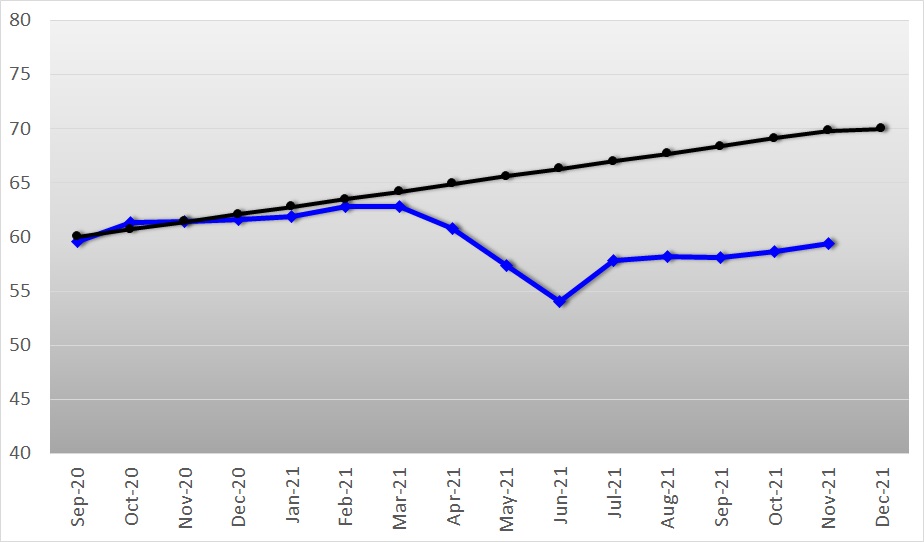
This increase is due to the deployment of money into the above mentioned high quality, high safety score stocks as well as from dividend increases mostly on above my current average. Additionally, the sale of GAIN with a low score helped a little bit, too.
I consider the score of below 60 as not acceptable end and my target is a score of 70. My goal was to reach this target by the end of 2021. However, the investments in alternative assets plus the drop of AT&T’s (T) dividend safety score have pushed this target out of reach.
Nonetheless, I will keep focusing on adding high quality stocks for the foreseeable future. My plan is not to sell low rated stocks but instead re-balance to high scoring ones when deploying more money. For July we are back on this plan.
Let’s look at the actual distribution. I use the same classification as Simply Safe Dividends as it makes it easy to spot the categories. You see that I also created an unclassified category.
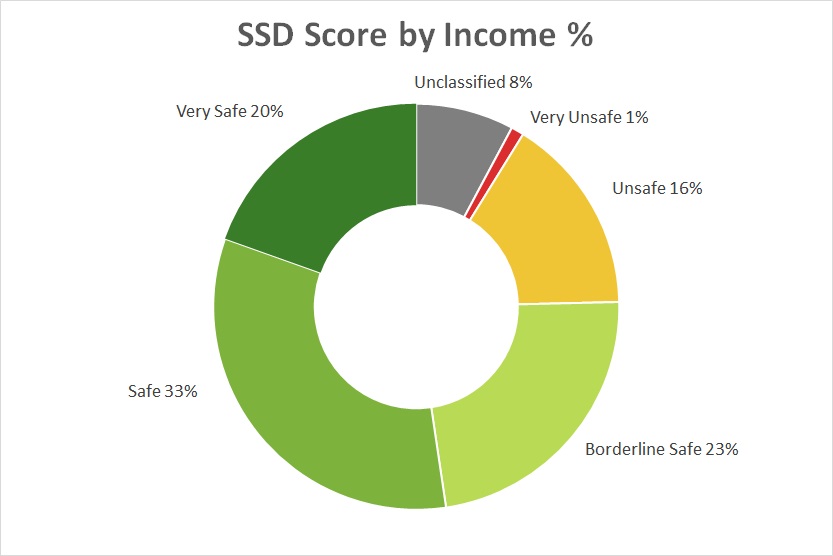
The different categories and their respective score ranges from very unsafe to very safe are:
In my portfolio now more than half (53%) of my portfolio is in the Safe and Very Safe category which has very little risk of being cut. Another 23% is Borderline Safe. The remaining 17% are Unsafe or Very Unsafe. 8% are unclassified and have a score of 0. I need to monitor especially the unsafe positions closely.
In November there has been no significant shift between categories.
Dividend Safety Score Stock by Stock
For each individual stock in my portfolio the current score is as follows:
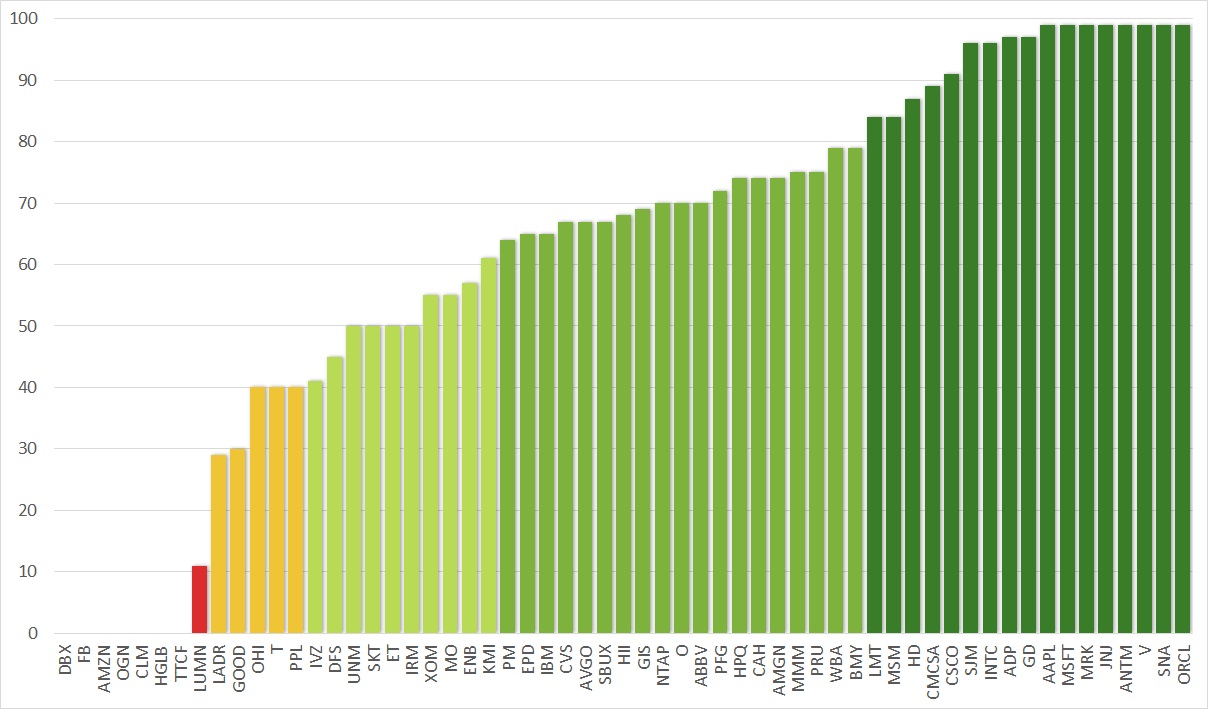
I hold now 17 companies in the highest category of Very Safe, of which 8 actually have the highest score of 99, and another 20 companies is the second highest category Safe. Overall, my portfolio contains many high quality dividend stocks with a safe dividend score.
On the other end we see the red alarming light with LUMN (formerly CTL). It is only a small position and I am not concerned about this one.
LADR as it is my largest position for dividend income and as such gives me the most exposure to a potential dividend cut. GAIN has now been removed from the list. PPL is smaller positions and has a risk of a dividend cut. My sell order is placed. Still not sure what to do about T. I will have to monitor closely if there are any negative signs.
Dividend Safety of Income Distribution
When combining the dividend safety score with the income the picture looks as follows:
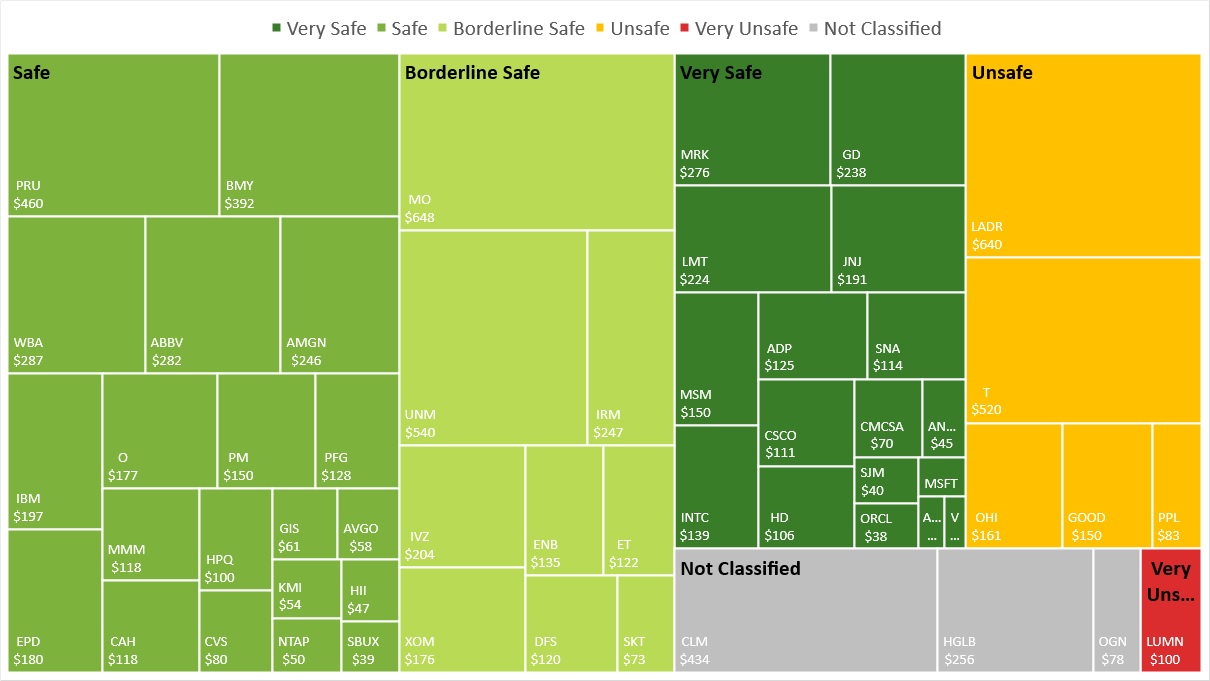
You can see that the largest group has become the Safe category, closely followed by the Borderline Safe one. However, the Very Safe category continues to grow and has become a sizable portion of my portfolio. I am very happy with this and expect this one to grow over time.
With T having in the Unsafe category, its size is substantial. I am still not sure what the best course of action is for this stock: holding or selling. LADR I bought at a very good time and would expect no mayor issues for now.
Dividend Safety and Yield
Another way of looking at the dividend safety is by yield and score. For each of my holdings I compare these values to visualize the figures which clearly lets you draw some general conclusions.
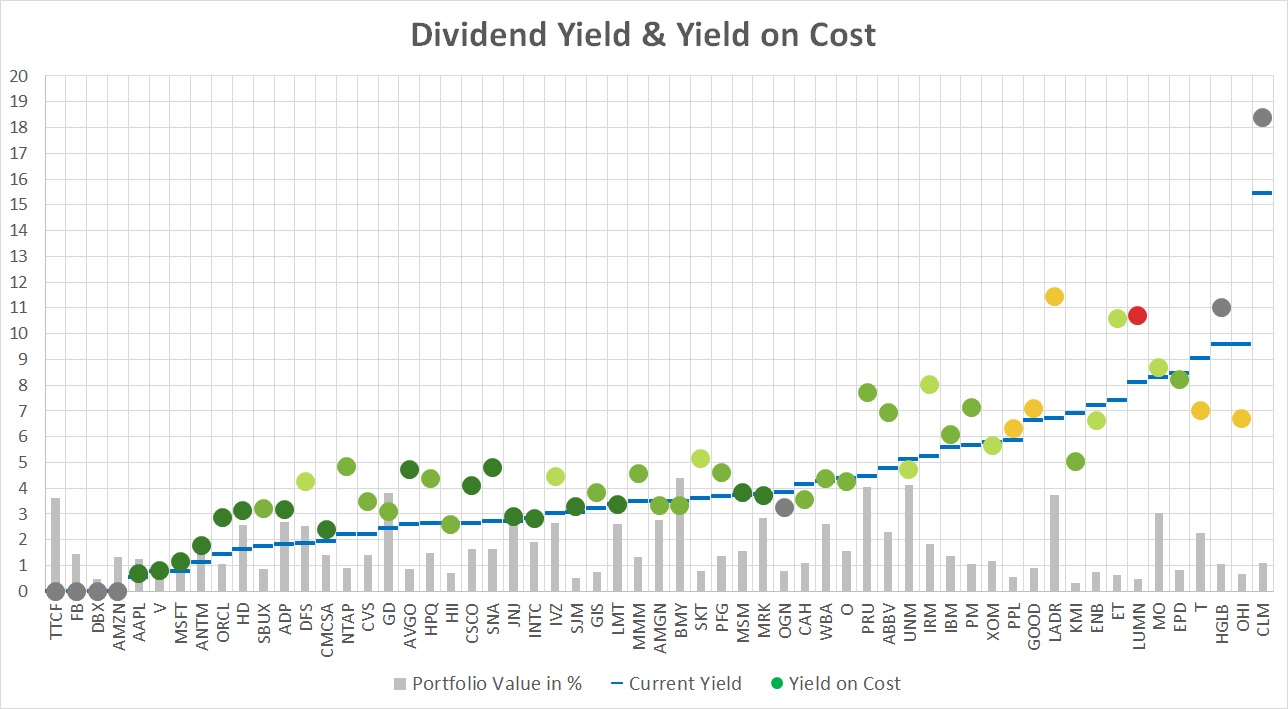
The dots represent my yield-on-cost with the color of the dividend safety score. The blue lines indicate the current yield of these stocks. The grey dots represent companies that either do not pay a dividend or are not covered by SSD. The light grey bars represent the percentage of the stock value in my portfolio.
There is a clear correlation between yield and safety score. On the left hand side (apart from the grey dots) we have the low yield, high safety score companies. The further we go to the right, the lower the dividend safety score becomes but it typically comes with a higher yield.
If the blue line (current yield) is below the dot (yield on cost) it means that either the stock has appreciated in price or the dividend was raised or both. Companies recovered quite nicely after the lows in March 2020 and most of my stocks have a lower current yield than my yield on cost.
On the right hand side you can also see the extreme values that stocks can take on. CLM, HGLB, LUMN, ET and LADR have a yield on cost of above 10%. However, one of my goals going forward is not to chase the yield as we can so clearly see that it comes with a lot of risk. Still, if I see an opportunity I am open to explore it.
Over time, I would like to see the left zone to experience a push upwards of the dots as dividend increases impact on my yield-on-cost.
At the same time, my continuous adding to the positions typically increases the average cost and lowers the yield-on-cost.
Projected Annual Dividend Income (PADI)
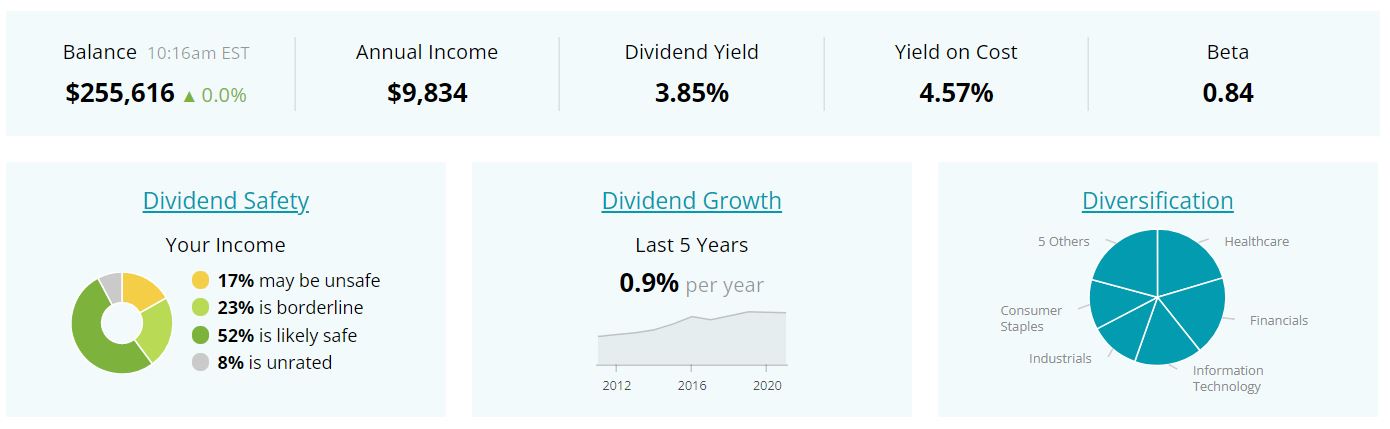
My Projected Annual Dividend Income (PADI) increased to $9,834 in November compared to $9,555 at the end of October. This is a rise of $279 or 2.9%.
As shown in my purchases section the increase was fueled by gains from options trading deployed into new purchases with $264. The dividend raises added further $103. The sale of GAIN led to a reduction of $90.
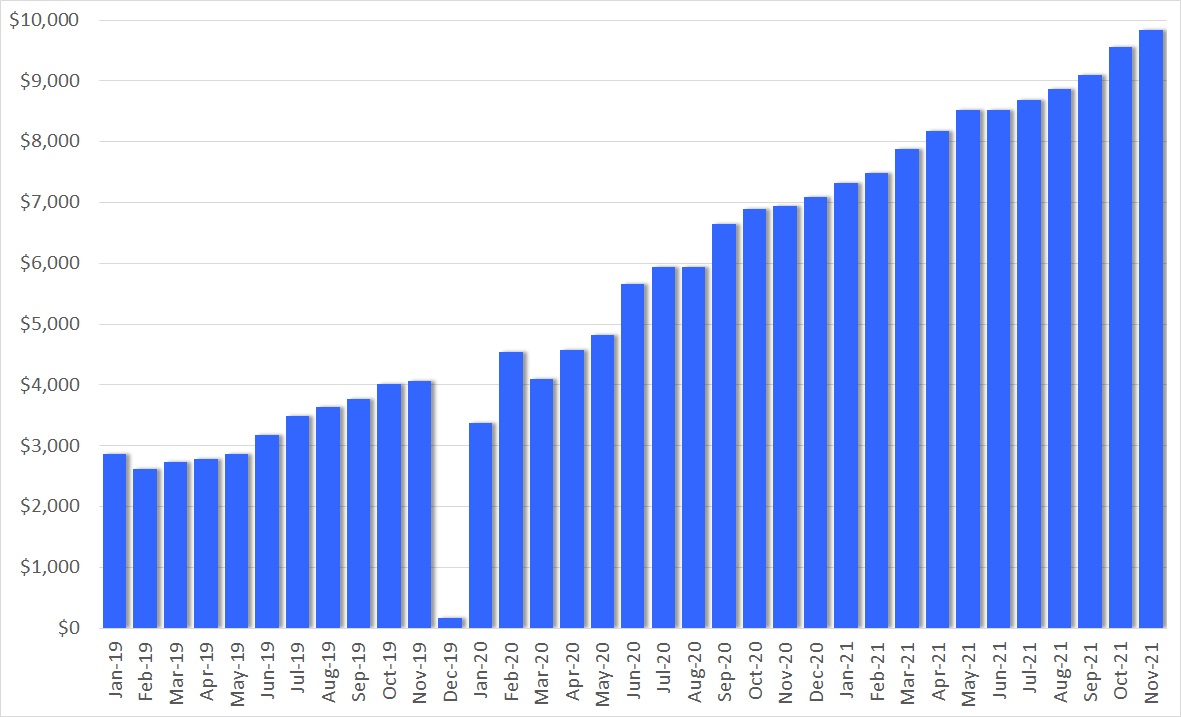
My journey continues to invest in high quality dividend growth stocks. I maintain myself firm to invest in undervalued stocks. The 10K mark is closer than ever.
However, the voices for a potential crash after a final blow off top rally are increasing and getting louder. I will be cautious to see how the markets evolve. A significant drop in the markets should help me deploy my money at a higher yield and generate higher returns in the long run. I need to watch my risk exposure on the options trading to have the margin available to boost income.
Portfolio Dividend Yield
The current yield of the shares in my portfolio is 3.85%, an increase of 0.13 compared to October.
The investment yield for my dividend growth portfolio is 4.57%. For this yield I compare the current dividend income with the purchase price of the underlying shares. A small decrease by 0.03 points. The new additions had a below average yield.
My yield on cost (YoC) is increasing again this month at 5.75%, up 0.03%, because of new dividend and options income as well as further dividend raises.
Conclusion
The dividend income for November was $752.98 from 18 different companies, a 41% increase compared to November last year. My PADI stands at $9,834 and has surpassed my 2021 target of $8,600 by a large amount.
The dividend safety score of my portfolio is 59.4, an increase of 0.7 points but still significantly below my set target of 70. My analysis has shown that 53% of my dividend income is categorized as safe, but there are still a few stocks with a high risk of being cut.
If you find the information provided helpful and inspiring please consider subscribing to my email list and you will never miss another update. I am also happy to receive comments either on the stocks I hold or other views you want to express. Thank you for having taken the time to read this post.
Disclosure: At time of writing long on all above mentioned
Disclaimer: I am not a professional investment or financial advisor. The information presented on this site represents my personal dividend growth journey and it is for informational purposes only. Opinions expressed are my own and should NOT be relied on or taken as investing advice. I have no knowledge about your personal situation and before you make any investment decision you should exercise due diligence and must do your own research. Always consider seeking advice from a professional financial and tax advisor.
I don’t recall you selling as much in the past as it appears you have done in December. Are you raising cash in your portfolio in anticipation of a correction where you can purchase shares at a higher cost on yield?
Thanks for the comment. I do still invest heavily but there are a few positions that I feel are not the core of my portfolio or I don’t have the conviction that there will be a great return. For this reason, I plan to sell IBM and PPL.
GAIN started to shot up the moment I had sold the call. Left some profits on the table. At the same time, they have a higher risk and lower dividend safety score. For that reason, I am not sad to have closed this position.
With regards to a potential correction, I cannot predict the market and stay fully invested. Actually, I am already slightly on margin. What I need to watch is my exposure on the naked options I sell. In a downturn they run quickly ITM and kill the opportunity to go heavy on margin for dividend stocks for a better yield on cost.