2021 is in the books and we ended our Dividend Growth Journey on a high with a maximum historical dividend income in a month and a new record five-digit Projected Annual Dividend Income (PADI). Additionally, the options income has supported this journey very nicely.
But not so fast. Every month I take the time to review my portfolio and dividend income. So how did we do in December?
In December I received $875.00 in dividends from a total of 26 companies. I like the way several companies pay me every month. Diversification for a dividend investor may be more important than for other investing strategies. I feel comfortable with the number of holdings in my portfolio.
My Projected Annual Dividend Income (PADI) has increased to $10,211 at the closing of the year 2021. What seemed out of reach only a few months ago has now become reality. I am proud to have reached this milestone of surpassing the 10K mark. It’s taken three and a half years to get there.
The wheel options strategy continues and December has been a great month. As you probably know I boost my income by trading the wheel. I short correction in December allowed me to sell some more puts with nice premiums.
Dividend Income
It is time to review the earnings of my dividend growth strategy. This is truly passive income. My December Dividend income in detail:
Amgen (AMGN) – income of $52.80
Anthem (ANTM) – income of $11.30
Broadcom (AVGO) – income of $16.40
Cornerstone Strategic Value Fund (CLM) – income of $32.04
Discovery Financial Services (DFS) – income of $30.00
Enbridge (ENB) – income of $32.54
Gladstone Commercial Corp (GOOD) – income of $12.53
Home Depot (HD) – income of $26.40
Highland Global Allocation Fund (ETF) (HGLB) – income of $21.30
Huntington Ingalls Ind. (HII) – income of $11.80
International Business Machines (IBM) – income of $49.20
Intel (INTC) – income of $34.75
Invesco (IVZ) – income of $51.00
Johnson & Johnson (JNJ) – income of $37.10
Lockheed Martin (LMT) – income of $56.00
Lumen (LUMN) – income of $25.00
3M (MMM) – income of $29.60
Microsoft (MSFT) – income of $6.20
Realty (O) – income of $14.76
Organon & Co. (OGN) – income of $19.60
Principal Financial Group (PFG) – income of $32.00
Prudential (PRU) – income of $115.00
M. Smucker Company (SMJ) – income of $9.90
Snap-on (SNA) – income of $28.40
Visa (V) – income of $3.75
Walgreens Boots Alliance (WBA) – income of $71.63
Exxon (XOM) – income of $44.00
PRU and WBA are my main contributors with $115 and $71 respectively. They make up 21% of my income in December. Not a lot of concentration can be observed. LMT has grown further as I added to the position on the dip.
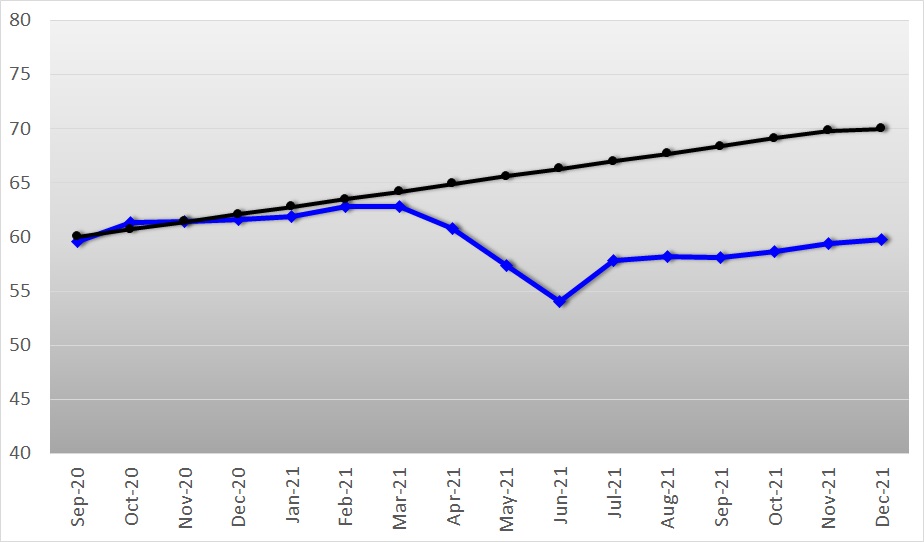
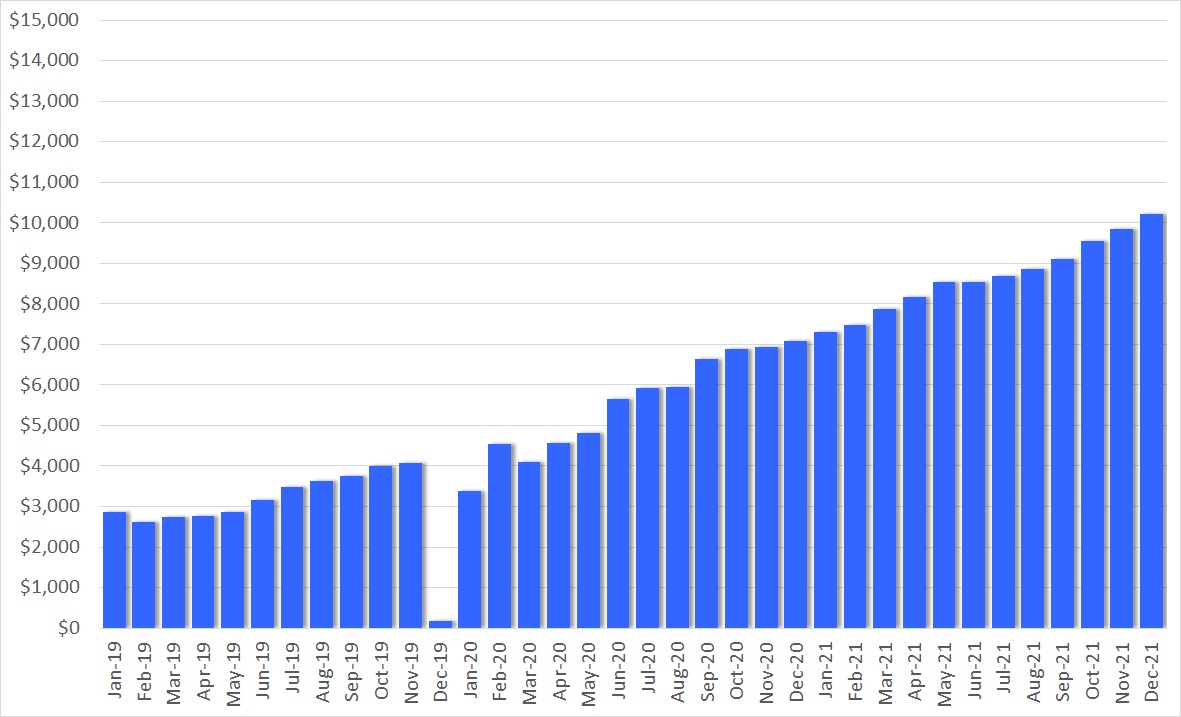
Overall, I like the way the dividend income looks and the chart confirms that I am going in the right direction.
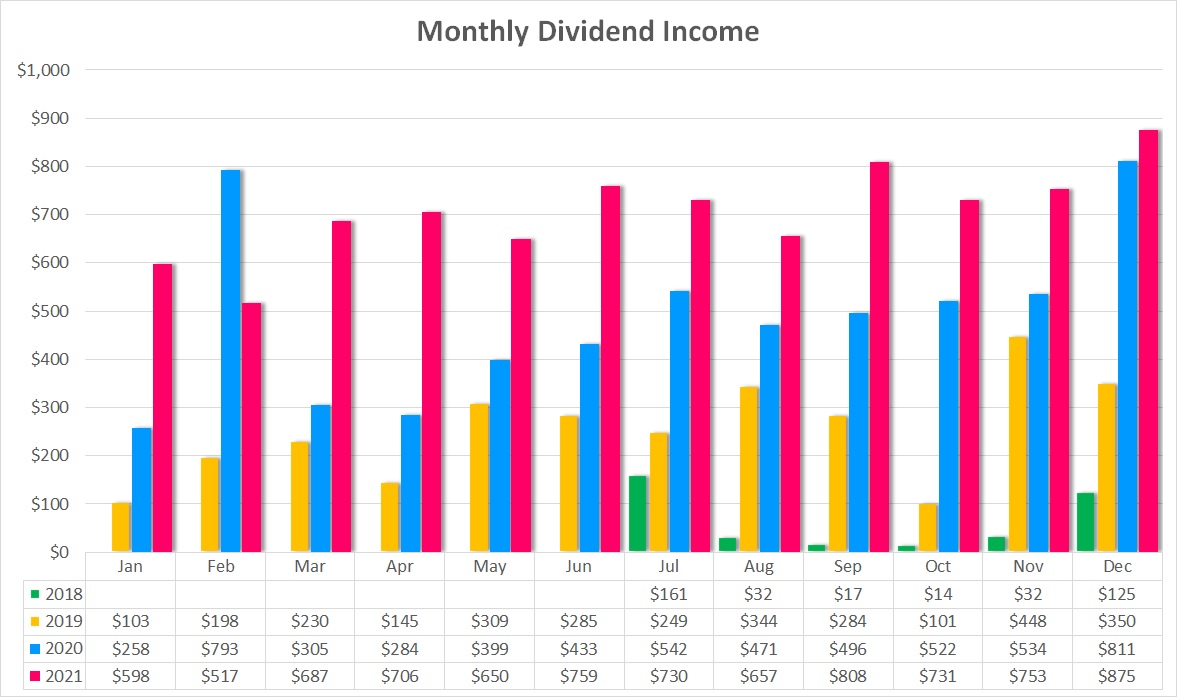
The above chart shows my monthly dividend income over time. In December 2021 I received $875.00 compared to December 2020 with $810.70 of income. This is an increase of $64.30 or 8%.
However, in December 2020 a special dividend from MSM was paid. This accounts for $175 alone. Without it the December 2020 total would have been $635.70 and the growth rate for December would be 38%.
Year over year I managed to increase my income from $5,845.78 in 2020 to $8,470.52 in 2021. That is an increase of $2,624.74 or 45%. This is an amazing growth rate and I will keep pushing myself to keep it up at such a high level for as long as I can.
Check out my current Dividend Income table for 2021 and the full overview of all the stocks.
Dividend Changes
In December there have been in total five dividend increases in my portfolio. The table below summarizes the total impact of $81.56, with a weighted average increase of 8.6%.
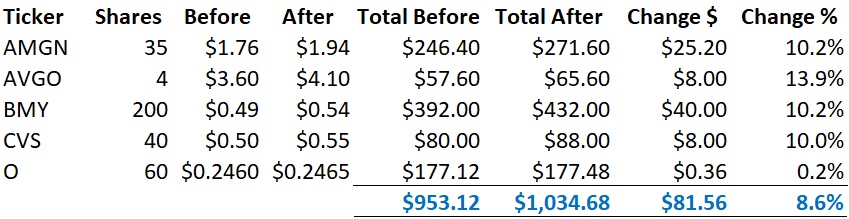
Four out of five have increased their dividend by 10% or more. This is exactly what I am looking for as a dividend growth investor. Additionally, Realty Income (O) has increased their dividend for the fifth time this year. The original monthly dividend at the beginning of the year was $0.2345 per share. Now it is $0.2465. That’s a total increase of 5.1%.
As a result of this change, my PADI increased by $81.56. At a yield of 3.0%, to achieve this dividend income I would have to deploy $2,718 of my hard earned money. But this is not necessary. The dividend increases take care of it and that’s the beauty of dividend growth investing and the compound effect in action. Reinvesting these dividends makes the snowball grow larger and larger over time.
The Dividend Growth Portfolio
In the Dividend Growth Portfolio I hold 61 different companies. Here is an overview of the status as of December 31st. I have excluded the stocks that I are part of my wheel strategy on which I got assigned.
Here is the Top-10 holding overview. In total, these 10 stocks make up 34.4% of my dividend growth portfolio. BMY in the top spot makes up 4.48% of my portfolio value. JNJ as the number 10 still accounts for 2.77% of the portfolio value.
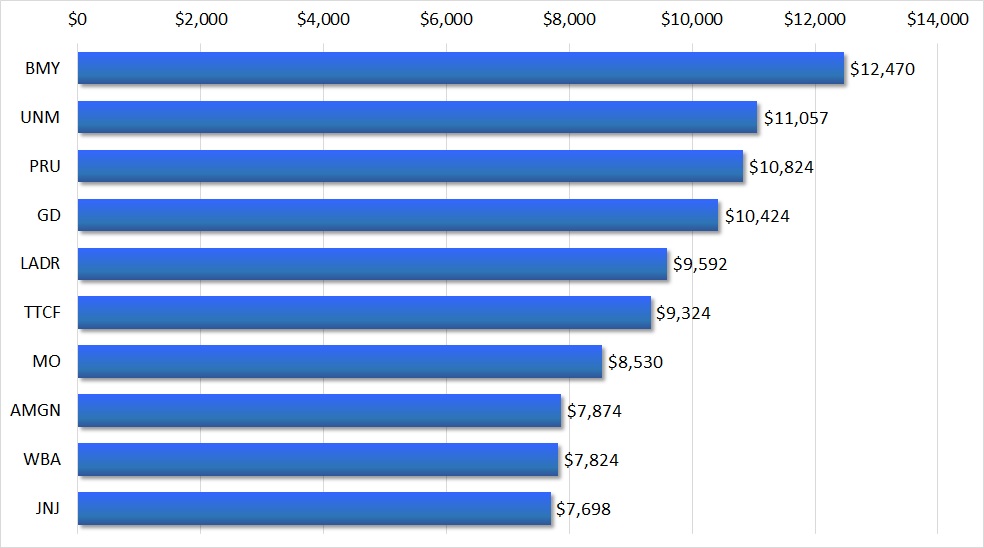
MRK has left the Top-10 again and WBA has replaced it. TTCF is a growth stock and does not pay any dividends.
Purchases
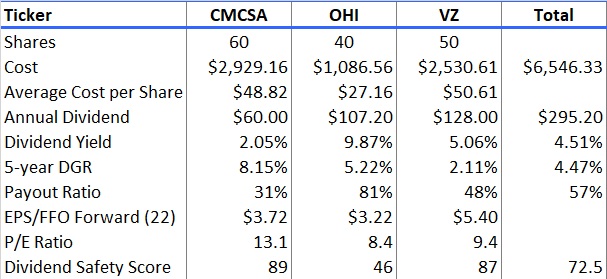
In December I added to two existing positions of high quality dividend growth stocks and added a new one. I added further to CMCSA when it dropped below $50 and OHI as it fell further. I started an initial position in VZ. All of these stocks I consider undervalued. Both CMCSA and VZ have a very good dividend safety score above 80 points (very safe category). OHI is a high yield, slightly more riskier investment.
Comcast Inc. (CMCSA)
Comcast is a core cable business and network provider for television, Internet access, and phone services to roughly 60 million U.S. homes and businesses, or nearly half of the country. About 55% of the homes in this territory subscribe to at least one Comcast service. Comcast acquired NBC Universal from General Electric in 2011. NBCU owns several cable networks, including CNBC, MSNBC, and USA, the NBC broadcast network, several local NBC affiliates, Universal Studios, and several theme parks. Sky, acquired in 2018, is the dominant television provider in the U.K. and has invested heavily in exclusive and proprietary content to build this position. The firm is also the largest pay-television provider in Italy and has a presence in Germany and Austria.
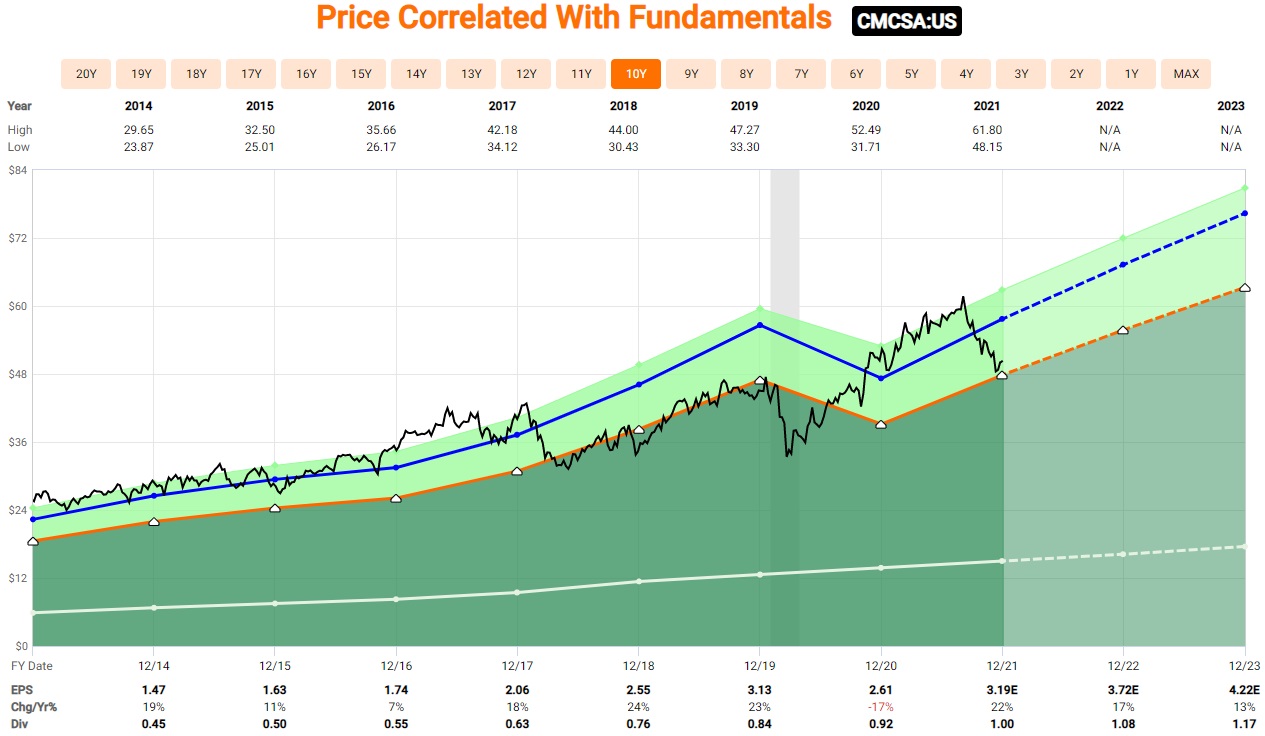
Source: FastGraphs
Omega Healthcare Investors Inc (OHI)
Omega Healthcare Investors Inc. is a healthcare facility real estate investment trust that invests in the United States real estate markets. Omega’s portfolio focuses on long-term healthcare facilities. The company maintains dual goals of increasing its returns to investors while also maintaining a high level of care for residents. Omega works to obtain contractual rent escalations under long-term leases, along with fixed-rate mortgage loans. The company considers merger and acquisition investment as a component of its operational growth strategy.
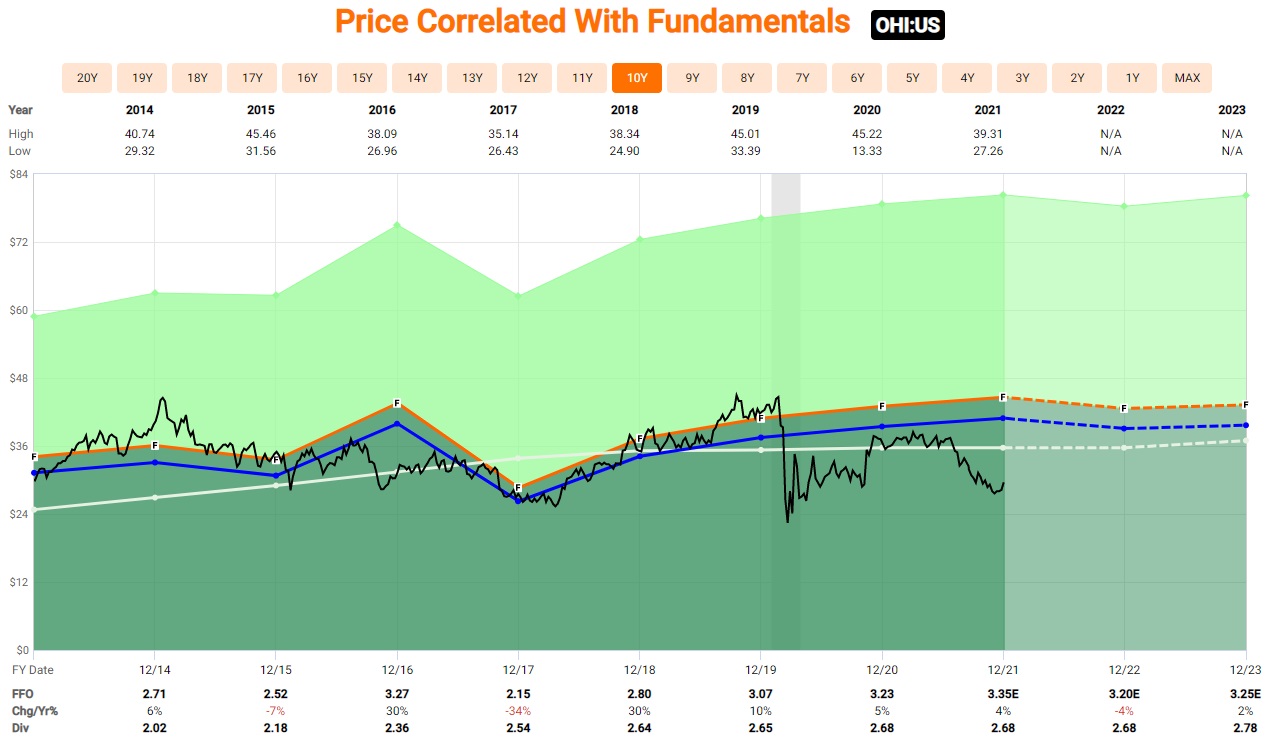
Source: FastGraphs
Verizon Communications Inc (VZ)
Verizon is now primarily a wireless business (more than 70% of revenue and nearly all operating income). It serves about 91 million postpaid and 4 million prepaid phone customers and connects another 25 million data devices, like tablets, via its nationwide network, making it the largest U.S. wireless carrier. The firm has agreed to acquire Tracfone, a wireless reseller that serves about 20 million prepaid customers in the U.S., from America Movil. Fixed-line telecom operations include local networks (12% of revenue) in the Northeast, which reach about 25 million homes and businesses, and nationwide enterprise services (10%). Verizon Media Group, the online media and advertising firm formed with the acquisitions of AOL and Yahoo, provides the remainder of revenue.
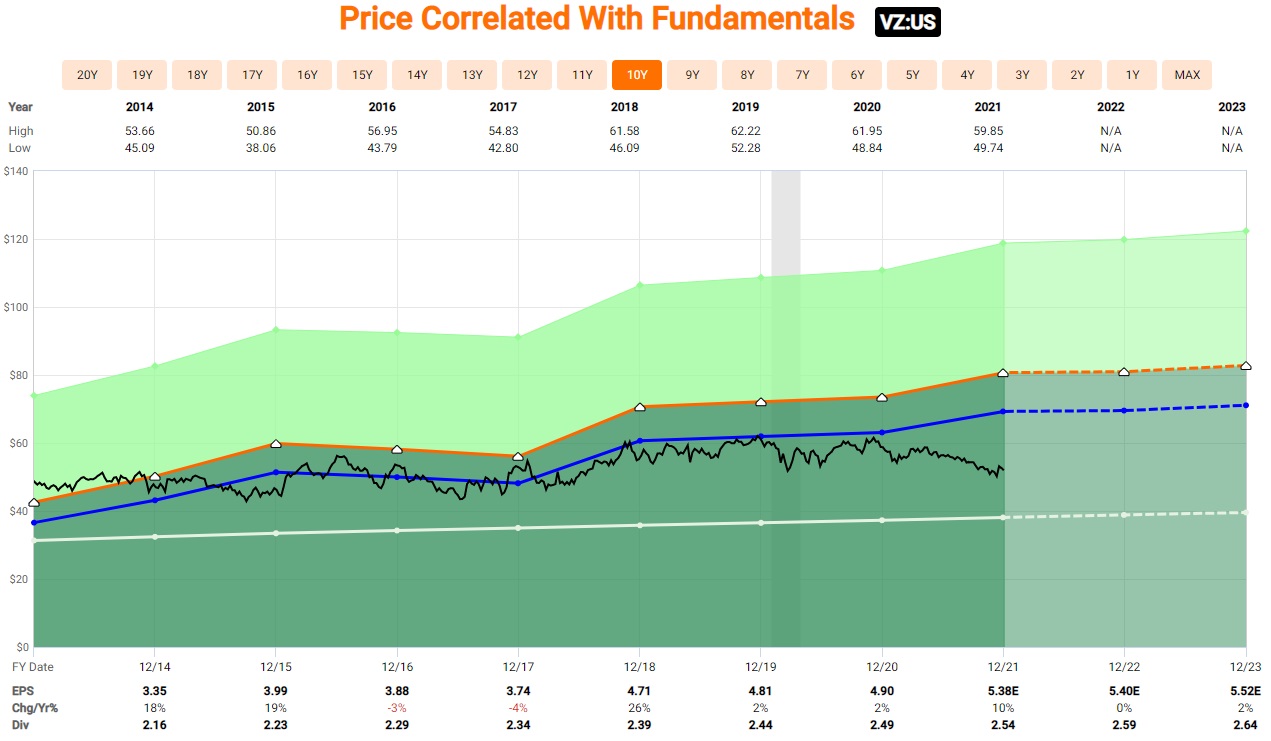
Source: FastGraphs
These are the companies I invested in during December. As a result, I have added $295.20 of dividend income to my Projected Annual Dividend Income (PADI). On an investment amount of $6,546.33 including fees it comes to an average dividend yield of 4.51%. This starting yield is well above the broader market.
Sales
There has been no sale in December for any of my positions.
My open order to sell PPL has not yet been filled but we are getting close. My limit order is at $30.55 and closing December the share price stood just above $30.
Additionally, I consider selling my full position in INTC which is 100 shares. I currently sell covered calls against it (right now with strike at $55 and expiration in February after rolling the $52 January call) until I let them get called away.
Check out my current Dividend Growth Portfolio and the full overview of all the stocks I hold in it. You can see now two sections: the dividend portfolio and the holdings on stock option wheel trading.
Dividend Safety
One of the key metrics for my future passive income is how safe it is. For this reason I track my portfolio average Dividend Safety Score. For this score I use the weighted dividend safety punctuation from Simply Save Dividends combined with the dividend income of each of my stocks. The higher the score the safer the dividend income.
Dividend Safety Score
For December, the Dividend Safety Score increased to 59.8 for my dividend growth portfolio, a change of 0.4 points compared to November.
This increase is due to the deployment of money into the above mentioned stocks as well as from dividend increases mostly with a dividend safety score well above my current average.
I consider the score of below 60 as not acceptable end and my target is a score of 70. My goal was to reach this target by the end of 2021. However, the last few months have shown that it will be a long way as my portfolio still does carry a significant weight on low score income and closed end funds which do not have a safety score.
Nonetheless, I will keep focusing on adding high quality stocks for the foreseeable future. My plan is not to sell low rated stocks but instead re-balance to high scoring ones when deploying more money. The target of an average score of 70 remains.
Let’s look at the actual distribution. I use the same classification as Simply Safe Dividends as it makes it easy to spot the categories. You see that I also created an unclassified category.
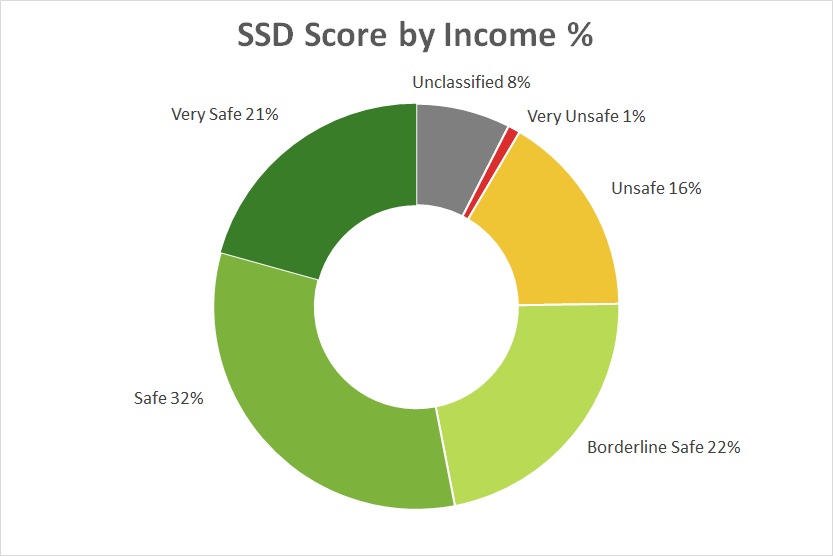
The different categories and their respective score ranges from very unsafe to very safe are:
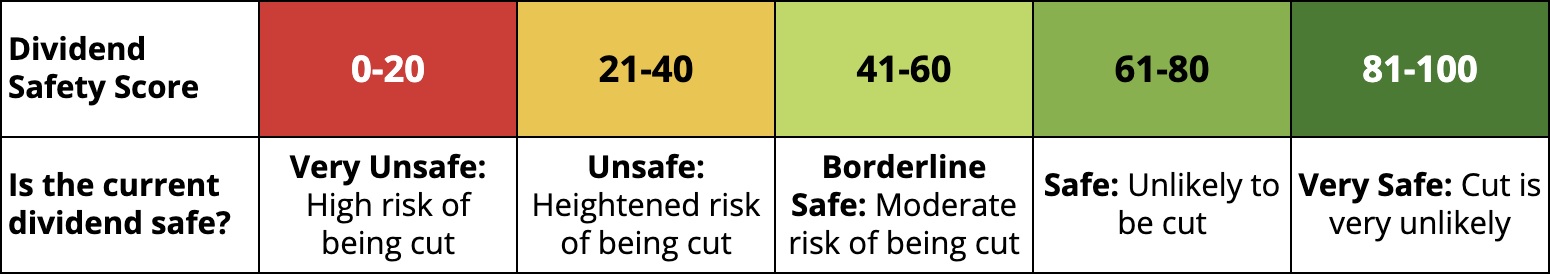
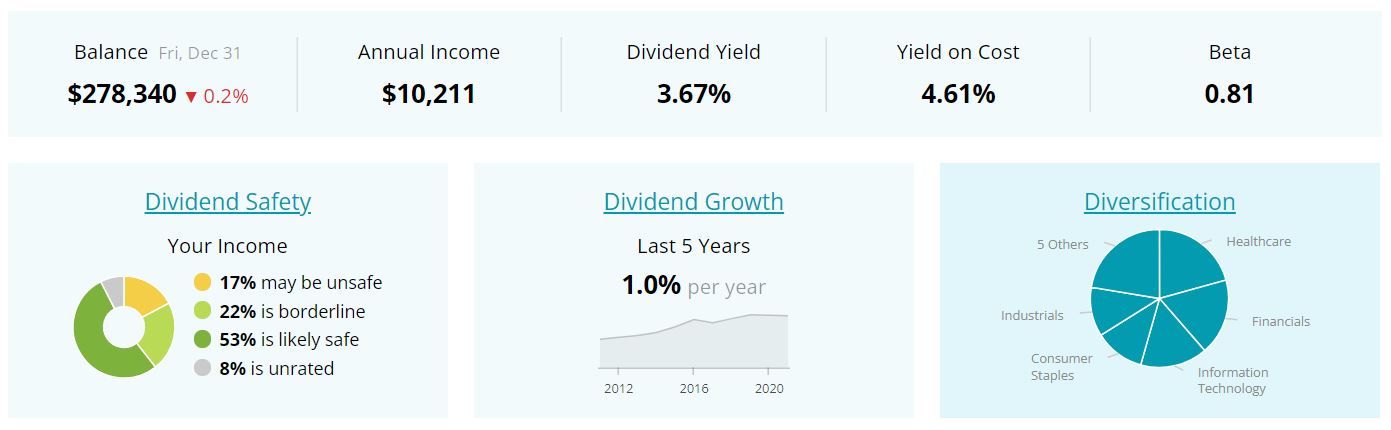
In my portfolio now more than half (53%) of my portfolio is in the Safe and Very Safe category which has very little risk of being cut. Another 22% is Borderline Safe. The remaining 17% are Unsafe or Very Unsafe. 8% are unclassified and have a score of zero. I need to monitor especially the unsafe positions closely.
In December there has been no significant shift between categories. The safe part of the pie chart just keeps growing slowly but surely.
Dividend Safety Score Stock by Stock
For each individual stock in my portfolio the current score is as follows:
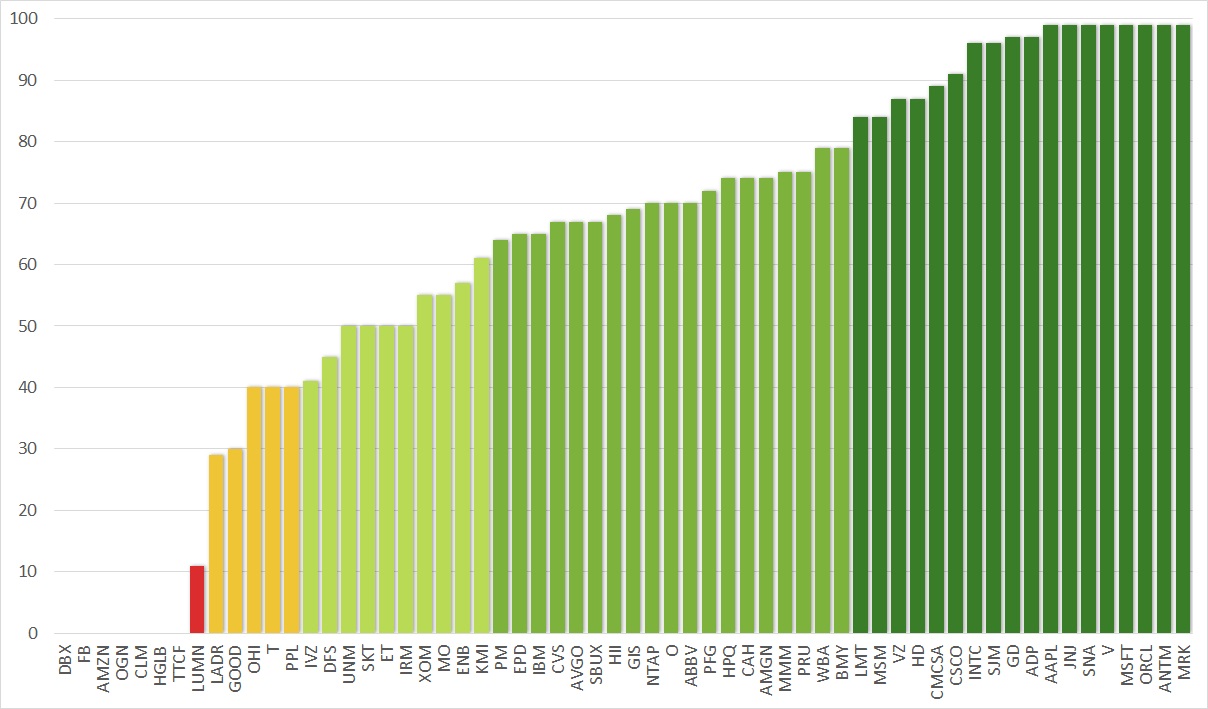
I hold now 18 companies in the highest category of Very Safe, of which 8 actually have the highest score of 99. This month Verizon Communications Inc (VZ) joined this group. Another 20 companies is the second highest category Safe. Overall, my portfolio contains many high quality dividend stocks with a safe dividend score.
On the other end we see the red alarming light with LUMN (formerly CTL). It is only a small position and I am not concerned about this one.
LADR as it is my largest position for dividend income and as such gives me the most exposure to a potential dividend cut. PPL is smaller positions and has a risk of a dividend cut. My sell order is placed as mentioned before. AT&T (T) remains in the portfolio for now.
Dividend Safety of Income Distribution
When combining the dividend safety score with the income the picture looks as follows:
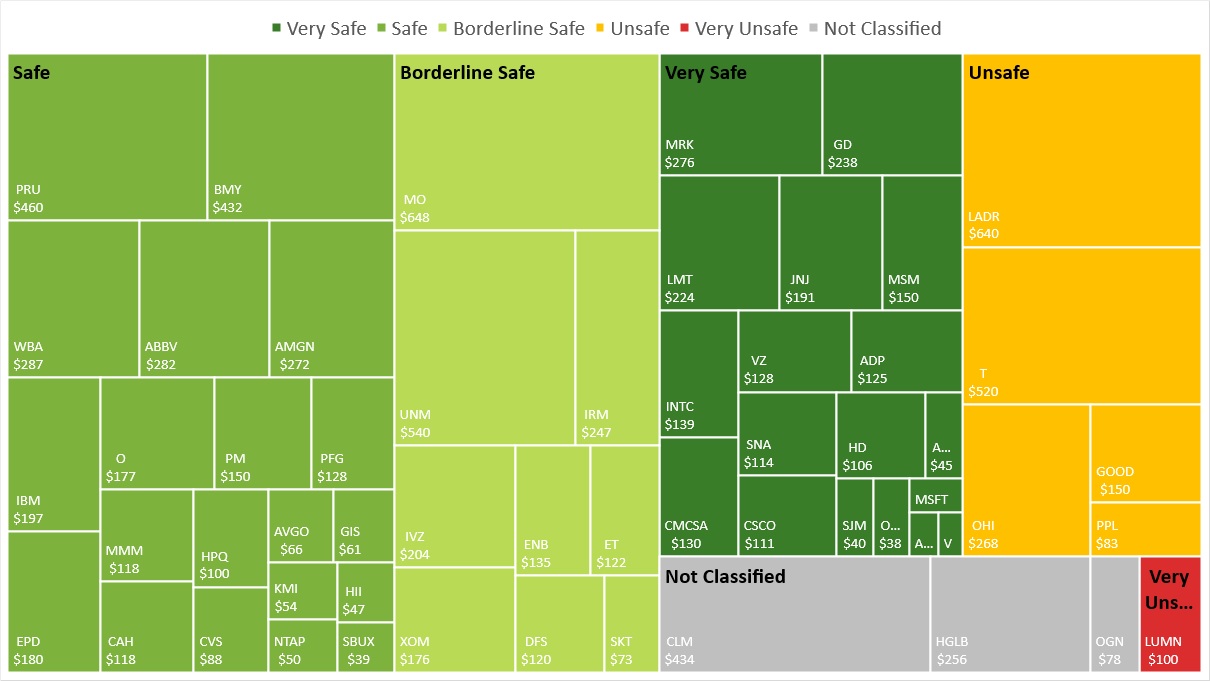
You can see that the largest group is the Safe category, followed by the Borderline Safe one. However, the Very Safe category continues to grow and has become a sizable portion of my portfolio. I am very happy with this and expect this one to grow over time.
With T having in the Unsafe category, its size is substantial. I am still not sure what the best course of action is for this stock: holding or selling. LADR I bought at a very good time and would expect no mayor issues for now. I also added more to OHI in this category.
Dividend Safety and Yield
Another way of looking at the dividend safety is by yield and score. For each of my holdings I compare these values to visualize the figures which clearly lets you draw some general conclusions.
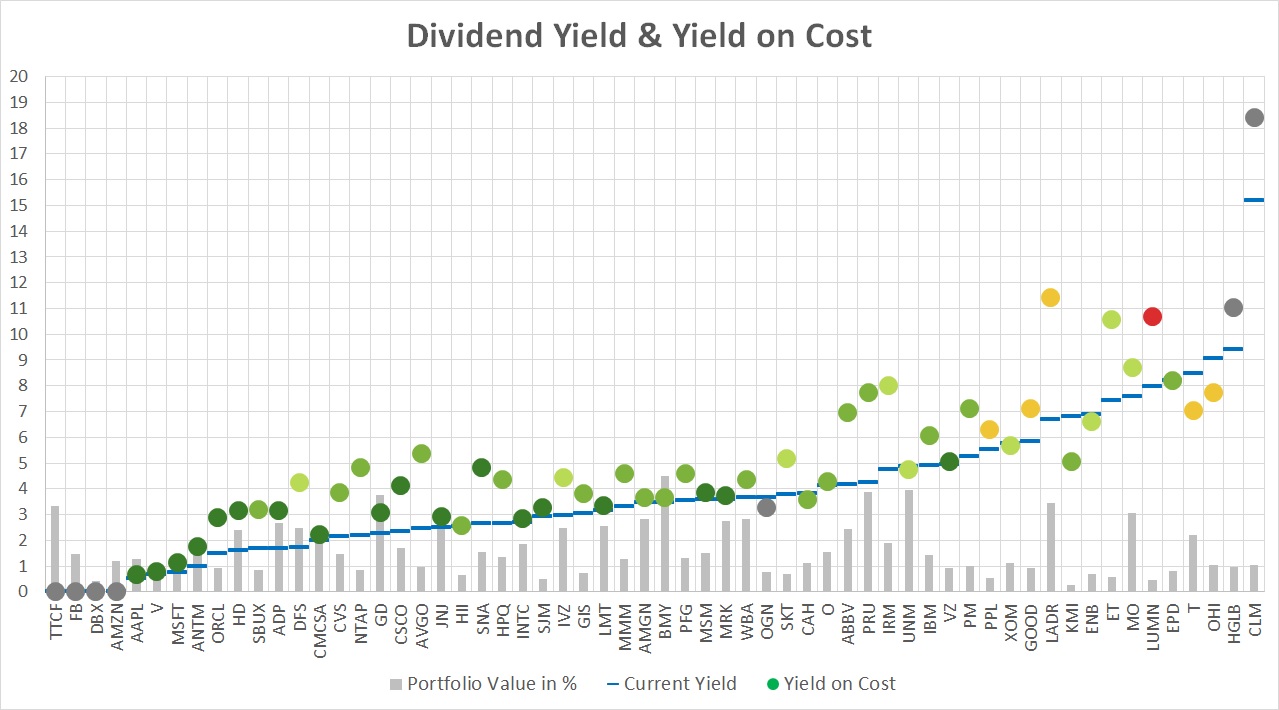
The dots represent my yield-on-cost with the color of the dividend safety score. The blue lines indicate the current yield of these stocks. The grey dots represent companies that either do not pay a dividend or are not covered by SSD. The light grey bars represent the percentage of the stock value in my portfolio.
There is a clear correlation between yield and safety score. On the left hand side (apart from the grey dots) we have the low yield, high safety score companies. The further we go to the right, the lower the dividend safety score becomes but it typically comes with a higher yield.
If the blue line (current yield) is below the dot (yield on cost) it means that either the stock has appreciated in price or the dividend was raised or both. Companies recovered quite nicely after the lows in March 2020 and most of my stocks have a lower current yield than my yield on cost.
On the left hand side you see the high quality stock with a high dividend safety score. They typically pay only a low to moderate dividend. However, most of them have relatively high dividend growth rates as we saw again in December with double digit increases.
On the right hand side you can also see the extreme values that stocks can take on. CLM, HGLB, LUMN, ET and LADR have a yield on cost of above 10%. CLM after the raise for 2022 is even close to 20%. However, one of my goals going forward is not to chase the yield as we can so clearly see that it comes with a lot of risk. Still, if I see an opportunity I am open to explore it.
Over time, I would like to see the left zone to experience a push upwards of the dots as dividend increases impact on my yield-on-cost.
At the same time, my continuous adding to the positions typically increases the average cost and lowers the yield-on-cost.
Projected Annual Dividend Income (PADI)
My Projected Annual Dividend Income (PADI) increased to $10,211 in December compared to $9,834 at the end of November. This is a rise of $377 or 3.8%.
In the end I managed to hit the 10K milestone still in 2021. This is huge. Looking back to July/August I felt this was impossible. I couldn’t be more excited about this fantastic progress of my dividend growth portfolio.
As shown in my purchases section the increase was fueled by contributions and gains from options trading deployed into new purchases with $295. The dividend raises added further $82 to it.
My journey continues to invest in high quality dividend growth stocks. I maintain myself firm to invest in undervalued stocks. The next big target for 2022 I will reveal in my Goals 2022 review.
Portfolio Dividend Yield
The current yield of the shares in my portfolio is 3.60%, a decrease of 0.25 compared to November. The stock market rallied at the end of the year and yield dropped overall.
The investment yield for my dividend growth portfolio is 4.62%. For this yield I compare the current dividend income with the purchase price of the underlying shares. A small increase by 0.05 points.
My yield on cost (YoC) has dropped this month to 5.67% by 0.08 points, because of significant new contributions which increased my overall cost basis. Dividends and options income did not manage to compensate but it is not a problem at all as new contributions will fuel future growth of my dividend growth portfolio.
Conclusion
The dividend income for December was $875.00 from 26 different companies, an 8% increase compared to December last year. My PADI stands at $10,211 and has surpassed my 2021 target of $8,600 by a mile.
The dividend safety score of my portfolio is 59.8, an increase of 0.4 points but still significantly below my set target of 70. My analysis has shown that 53% of my dividend income is categorized as safe, but there are still a few stocks with a high risk of being cut.
If you find the information provided helpful and inspiring please consider subscribing to my email list and you will never miss another update. I am also happy to receive comments either on the stocks I hold or other views you want to express. Thank you for having taken the time to read this post.
Disclosure: At time of writing long on all above mentioned
Disclaimer: I am not a professional investment or financial advisor. The information presented on this site represents my personal dividend growth journey and it is for informational purposes only. Opinions expressed are my own and should NOT be relied on or taken as investing advice. I have no knowledge about your personal situation and before you make any investment decision you should exercise due diligence and must do your own research. Always consider seeking advice from a professional financial and tax advisor.
Hi,
I hope that you know what you are doing with your options.
Be carefull.
Hi Jeffrey, thanks for your concern. I must admit that the start of 2022 has been anything but smooth. I will need to review my risk assessment for options and take a more conservative approach.
DGJ