We are in the last quarter of the year and October is in the books. The dividend income for October was well in line with my expectations and I added to several positions in my dividend growth portfolio.
In October I received $731.21 in dividends from a total of 18 companies. I like the way several companies pay me every month. Diversification for a dividend investor may be more important than for other investing strategies.
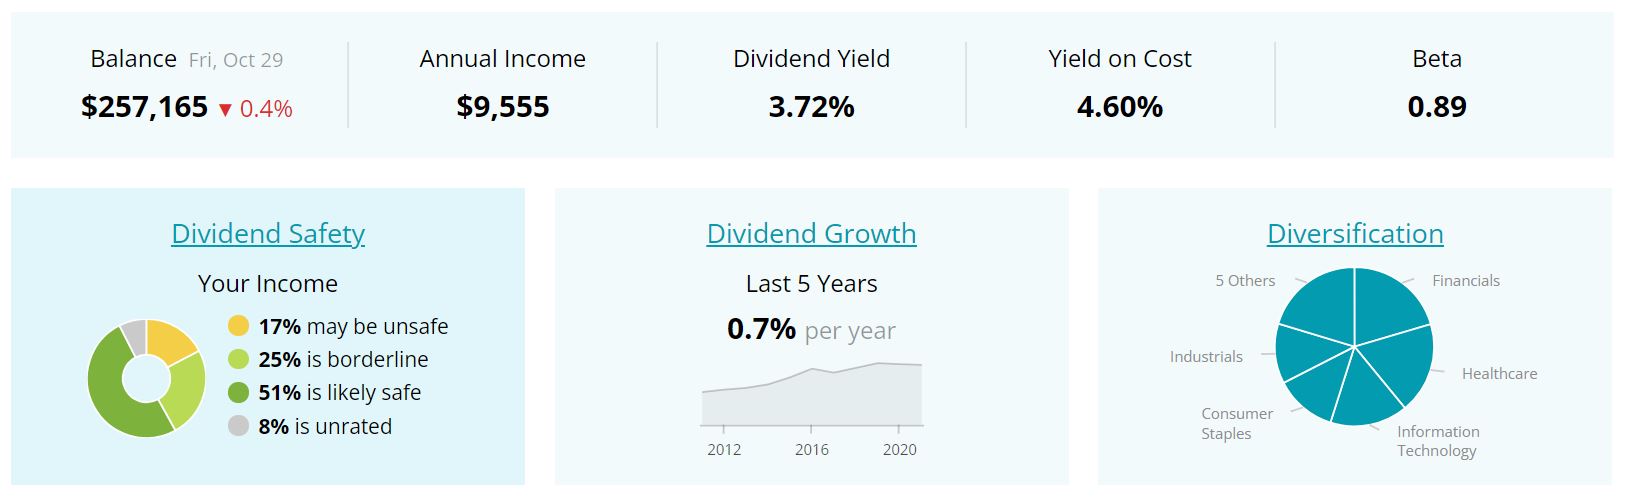
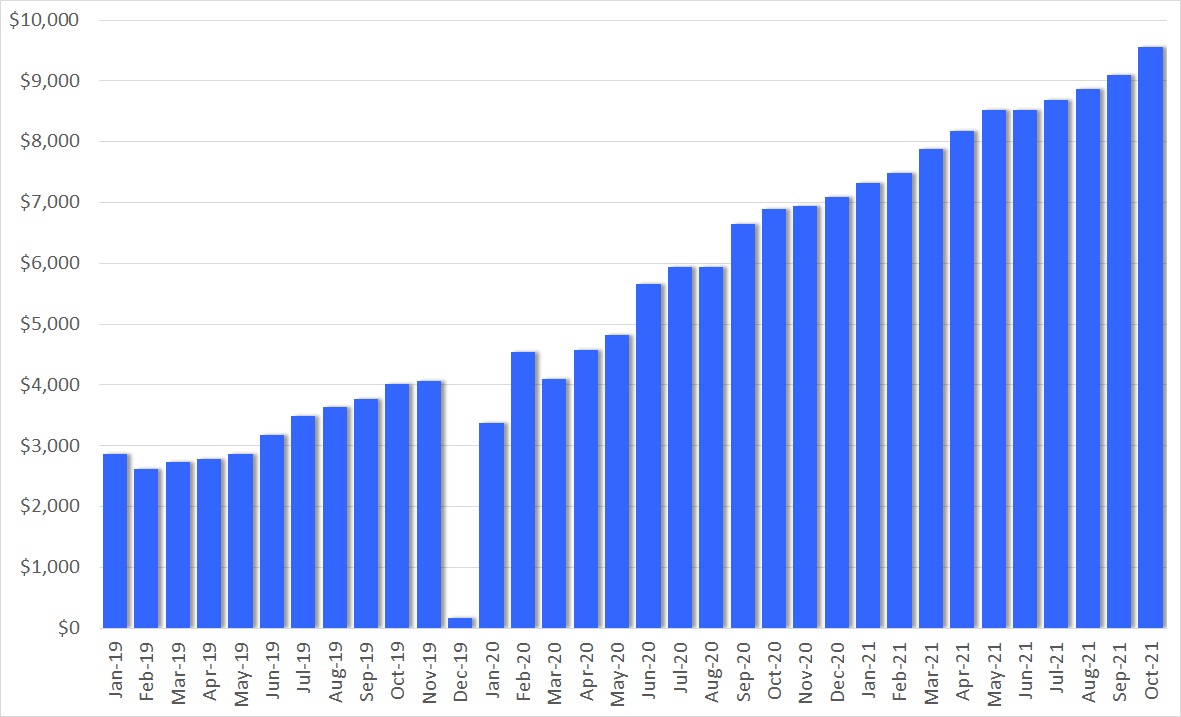
My Projected Annual Dividend Income (PADI) has been pushed passed the $9,000 mark in September and received another boost in October. It now stands at $9,555 and the five figure milestone is getting in reach.
The wheel options strategy continues and October has been a great month. As you probably know I boost my income by trading the wheel. I sold puts on PLTR, HPQ, JBL, CWH and VTRS. Others that I had sold earlier on CRM, TTCF, and BWL, I closed in October. Still, the RIDE position is dragging my performance down.
Dividend Income
It is time to review the earnings of my dividend growth strategy. This is truly passive income. My October Dividend Income in detail:
Advanced Data Processing (ADP) – income of $27.90
Cardinal Health (CAH) – income of $29.45
Cornerstone Strategic Value Fund (CLM) – income of $32.04
Comcast (CMCSA) – income of $10.00
Cisco Systems (CSCO) – income of $27.75
Gladstone Investment Corp (GAIN) – income of $7.50
Gladstone Commercial Corp (GOOD) – income of $12.53
Highland Global Allocation Fund (ETF) (HGLB) – income of $21.30
HP Inc. (HPQ) – income of $19.38
Iron Mountain (IRM) – income of $61.85
Ladder Capital (LADR) – income of $160.00
Altria (MO) – income of $162.00
Merck (MRK) – income of $65.00
NetApp (NTAP) – income of $12.50
Realty (O) – income of $14.16
Oracle (ORCL) – income of $9.60
Phillip Morris (PM) – income of $37.50
PPL Corp. (PPL) – income of $20.75
MO and LADR are my main contributors with $162 and $160 respectively. They make up 44% of my income in October. MRK has grown quite a bit as I added consistently to the stock over the last months.
MSM will only pay in November. They have a bit of an odd schedule for the dividends to be paid out.
No new contributors this month.
Overall, I like the way the dividend income looks and the chart confirms that I am going in the right direction.
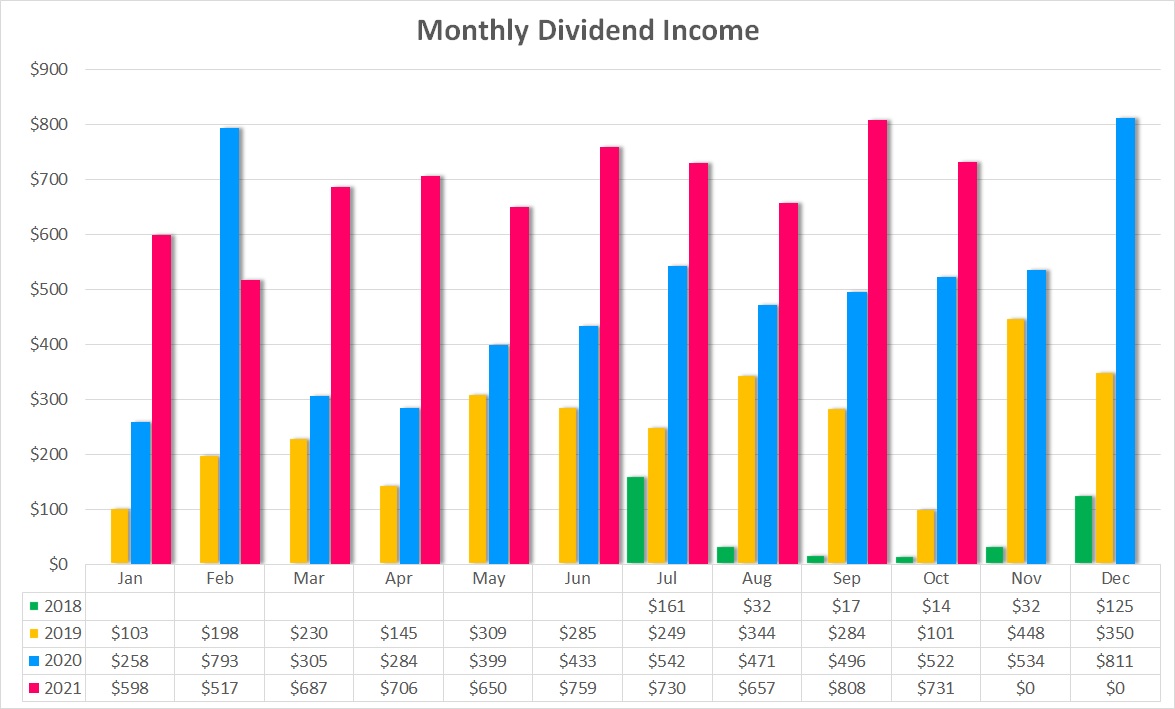
The above chart shows my monthly dividend income over time. In October 2021 I received $731.21 compared to October 2020 with $571.74 of income. This is an increase of $209.47 or 40%. This is a fantastic growth rate and I expect to keep pushing myself.
Year over year I managed to increase my income from $4,500.74 in the period January to October 2020 to $6,842.54 in the same period in 2021. That is an increase of $2,341.80 or 52%.
Check out my current Dividend Income Table for 2021 and the full overview of all the stocks.
Dividend Changes
In October there have been quite a few dividend increases in my portfolio. The table below summarizes the total impact of $54.80, with an average increase of 7.2%.
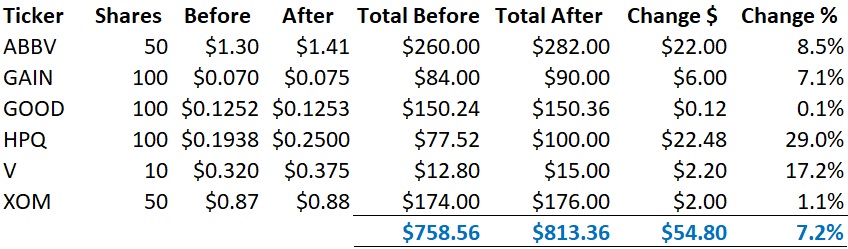
ABBV increased their dividend by 8.5% which is fully in line with expectations. It’s slowing down though.
GAIN surprised me quite a lot. I did not expect a raise at all as they pay extra dividends typically 2 or 3 times a year. A nice increase.
GOOD did not want to stand there doing nothing so Gladstone decided to give it a tiny raise of $0.0001 that is 0.1%.
HPQ pushed it really hard. A 29% raise! Their payout ratio is so low so that there is more room for that in the future.
V did not disappoint this time. A very solid 17.2% raise.
XOM did finally pull the trigger and raised their dividend, even though it is only 1 cent per quarter.
As a result of this change, my PADI increased by $54.80. At a yield of 3.0%, to achieve this dividend income I would have to deploy $1,826. But this is not necessary. The dividend increases take care of it and that’s the beauty of dividend growth investing and the compound effect in action.
The Dividend Growth Portfolio
In the Dividend Growth Portfolio I hold 60 different companies. Here is an overview of the status as of October 29th. I have excluded the stocks that I are part of my wheel strategy on which I got assigned.
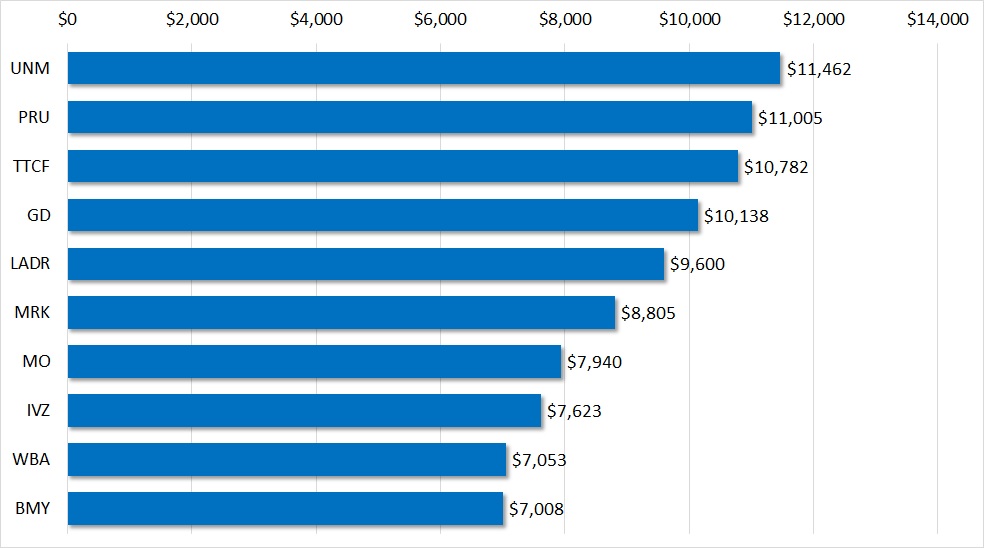
Here is the Top-10 holding overview. In total, these 10 stocks make up 35.5% of my dividend growth portfolio. UNM is ranked first with 4.46% of my portfolio value. DFS has left the Top-10 again and BMY has replaced it. TTCF is a growth stock and does not pay any dividends.
Book Recommendation of the Month*:
One Up On Wall Street: How To Use What You Already Know To Make Money In The Market
by Peter Lynch
One of America’s most successful money manager tells how average investors can beat the pros by using what they know. Investing does not need to be complicated and opportunities are everywhere. From the supermarket to the workplace to our own home, we encounter products and services all day long. By paying attention to the best ones, we can find companies in which to invest.
Check out my dividend investor book list for recommended readings!
* Affiliate Link
Purchases
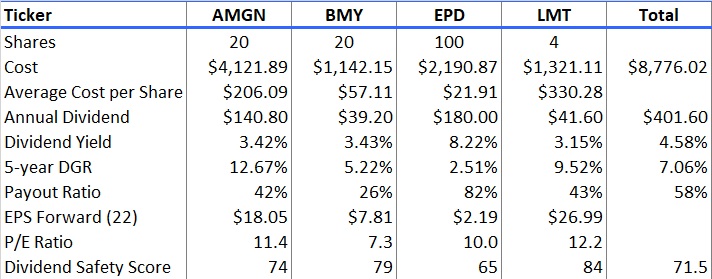
In October I added to three existing positions of high quality dividend growth stocks. I added further to AMGN which I started in September, BMY as the price keeps coming down and LMT after the massive drop when announcing lower than expected revenue and earnings for the next year. Additionally, I opened a position in Enterprise Products Partners L.P. (EPD). All of these stocks I consider undervalued and with a good to very good dividend safety score. The payout ratios are also in line with what I deem acceptable.
Amgen Inc (AMGN)
Amgen is a leader in biotechnology-based human therapeutics, with historical expertise in renal disease and cancer supportive-care products. Flagship drugs include red blood cell boosters Epogen and Aranesp, immune system boosters Neupogen and Neulasta, and Enbrel and Otezla for inflammatory diseases. Amgen introduced its first cancer therapeutic, Vectibix, in 2006 and markets bone-strengthening drug Prolia/Xgeva (approved 2010) and Evenity (2019). The acquisition of Onyx bolstered the firm’s therapeutic oncology portfolio with Nexavar and Kyprolis. Recent launches include Repatha (cholesterol-lowering), Aimovig (migraine), and Lumakras (lung cancer). Amgen’s biosimilar portfolio includes Mvasi (biosimilar Avastin), Kanjinti (biosimilar Herceptin), and Amgevita (biosimilar Humira).
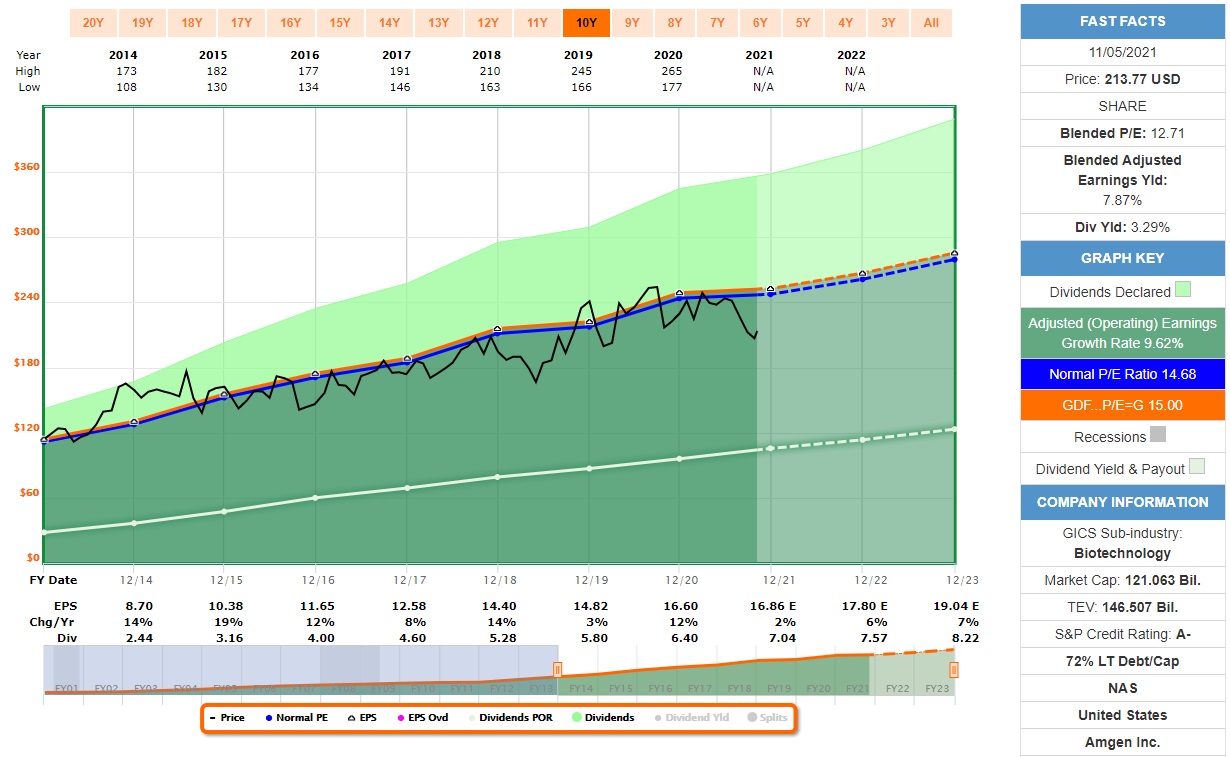 Source: FastGraphs
Bristol-Myers Squibb Co (BMY)
Bristol-Myers Squibb discovers, develops, and markets drugs for various therapeutic areas, such as cardiovascular, oncology, and immune disorders. A key focus for Bristol is immuno-oncology, where the firm is a leader in drug development. Unlike some of its more diversified peers, Bristol has exited several nonpharmaceutical businesses to focus on branded specialty drugs, which tend to support strong pricing power.
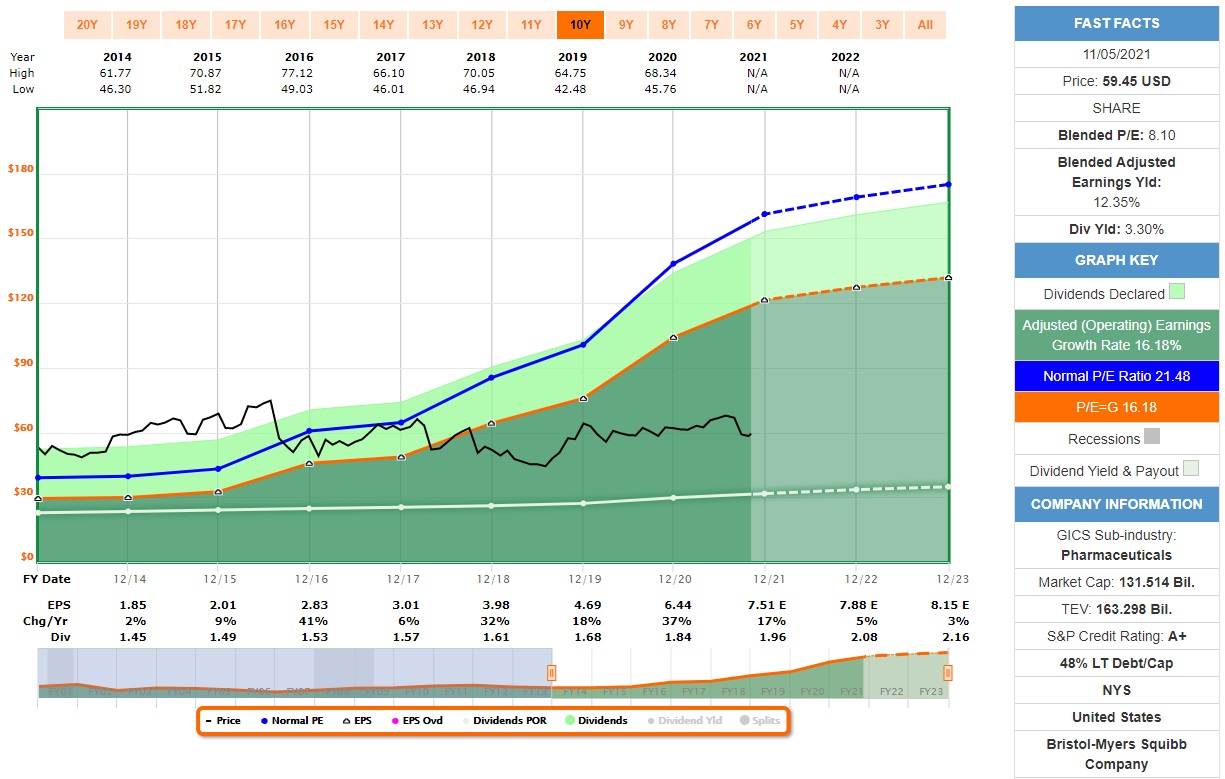 Source: FastGraphs
Enterprise Products Partners LP (EPD)
Enterprise Products Partners is a master limited partnership that transports and processes natural gas, natural gas liquids, crude oil, refined products and petrochemicals. It is one of the largest midstream companies, with operations servicing most producing regions in the Lower 48 states. Enterprise is particularly dominant in the NGL market and is one of the few MLPs that provide midstream services across the full hydrocarbon value chain.
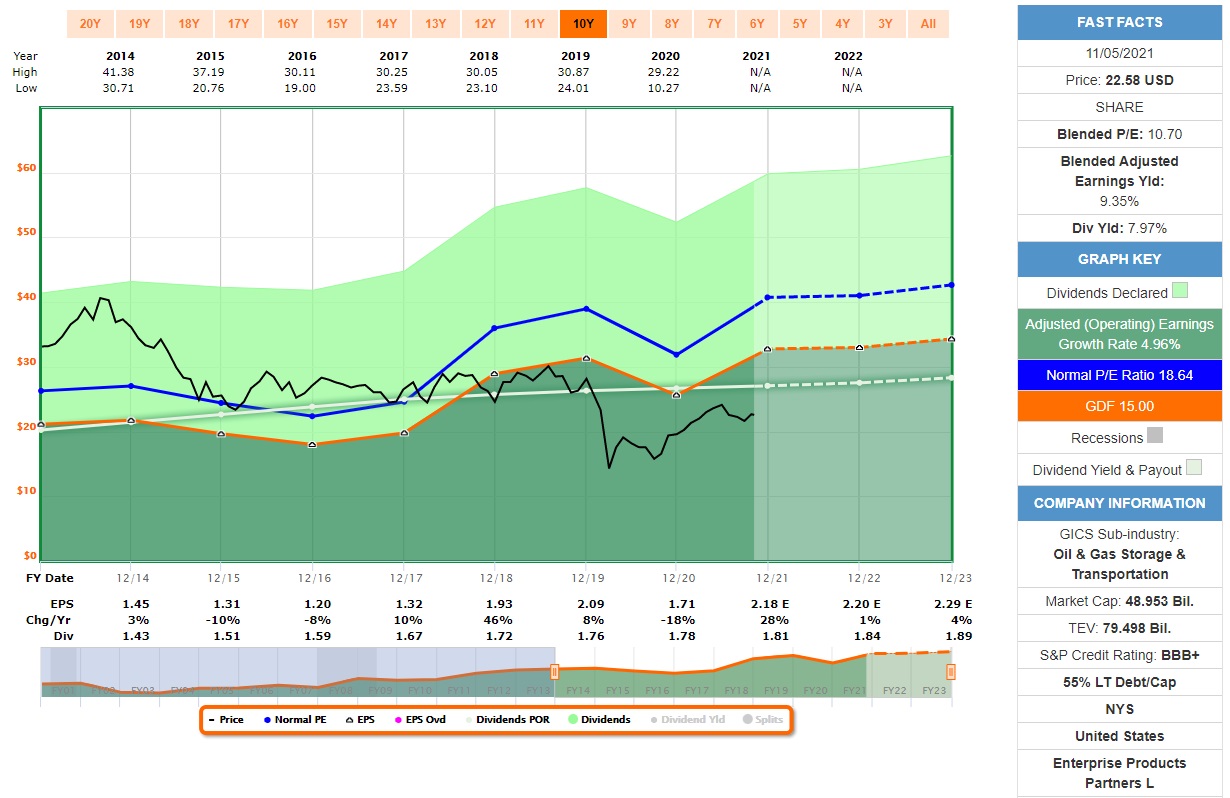 Source: FastGraphs
Lockheed Martin Corp (LMT)
Lockheed Martin is the largest defense contractor globally and has dominated the Western market for high-end fighter aircraft since being awarded the F-35 program in 2001. Lockheed’s largest segment is Aeronautics, which is dominated by the massive F-35 program. Lockheed’s remaining segments are rotary & mission systems, which is mainly the Sikorsky helicopter business; missiles and fire control, which creates missiles and missile defense systems; and space systems, which produces satellites and receives equity income from the United Launch Alliance joint venture.
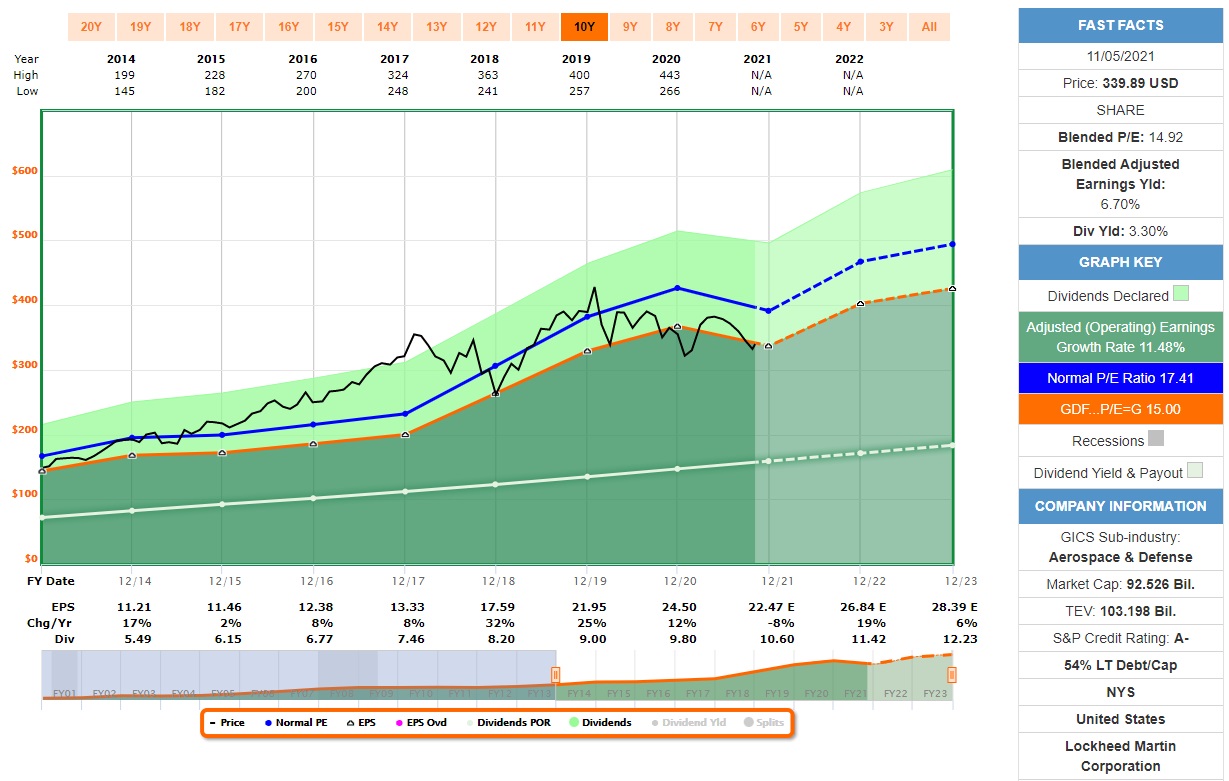 Source: FastGraphs
These are the companies I invested in during October. AMGN has a great trajectory and growth prospects and I am happy to finally have built a position. For BMY I am not too sure what holds the price back but eventually it will follow earnings and they are growing. Both, EPD and LMT are more conservative positions even though they might face difficulties in the short run.
As a result, I have added $401.60 of dividend income to my Projected Annual Dividend Income (PADI). On an investment amount of $8,776.02 including fees it comes to an average dividend yield of 4.58%. Obviously, EPD with a yield of 8.2% pushed the average up. All others are in the 3%+ range.
I also got assigned 4,000 more shares of RIDE with my options wheel strategy. It looked like RIDE had found support in the $7 range but it just kept plummeting further. This was a stupid trade I should not have made. My goal is to now sell calls against all 8,000 shares I hold and try to reduce losses. I am not yet at the point of liquidating the position.
It comes to show again and again that it is important to follow your set of rules and here we are with a stock I do not want to hold which I bought at a price I did not deem reasonable in the first place.
RIDE is my performance killer this year and I hope to get away with just a few bruises. Let’s see what happens over the next months.
Sales
I did not sell any stocks in October.
My open order to sell PPL has not yet been filled but we are getting close.
Additionally, I consider selling my full position in INTC, I just managed to sell a call against it in early November.
Check out my current Dividend Growth Portfolio and the full overview of all the stocks I hold in it. You can see now two sections: the dividend portfolio and the holdings on stock option wheel trading.
Dividend Safety
One of the key metrics for my future passive income is how safe it is. For this reason I track my portfolio average Dividend Safety Score. For this score I use the weighted dividend safety punctuation from Simply Save Dividends combined with the dividend income of each of my stocks. The higher the score the safer the dividend income.
Dividend Safety Score
For September, the Dividend Safety Score increased to 58.7 for my dividend growth portfolio, a change of 0.6 points compared to September.
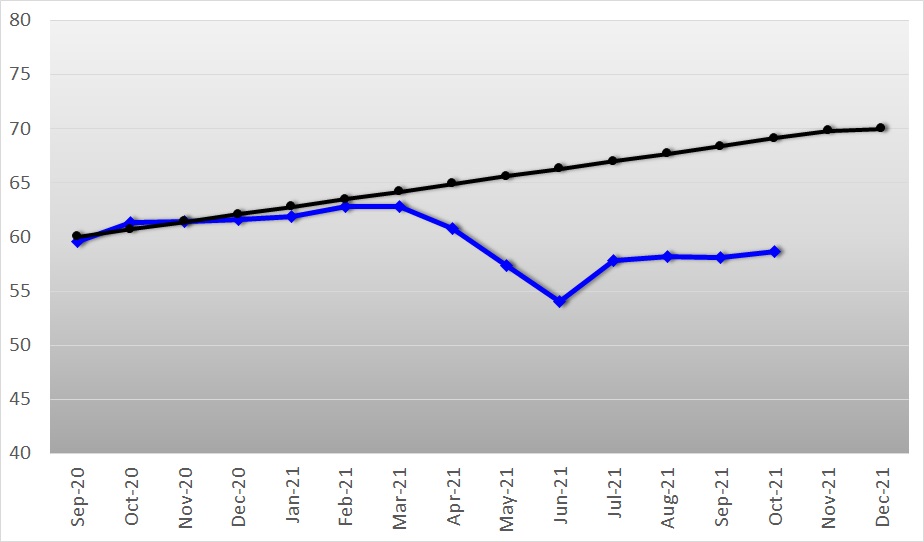
This increase is due to the deployment of money into the above mentioned high quality, high safety score stocks as well as from dividend increases mostly on above my current average.
I consider the score of below 60 as not acceptable end and my target is a score of 70. My goal was to reach this target by the end of 2021. However, the investments in alternative assets plus the drop of AT&T’s (T) dividend safety score have pushed this target out of reach.
Nonetheless, I will keep focusing on adding high quality stocks for the foreseeable future. My plan is not to sell low rated stocks but instead re-balance to high scoring ones when deploying more money. For July we are back on this plan.
Let’s look at the actual distribution. I use the same classification as Simply Safe Dividends as it makes it easy to spot the categories. You see that the unclassified category has increased quite a bit.
The different categories and their respective score ranges from very unsafe to very safe are:
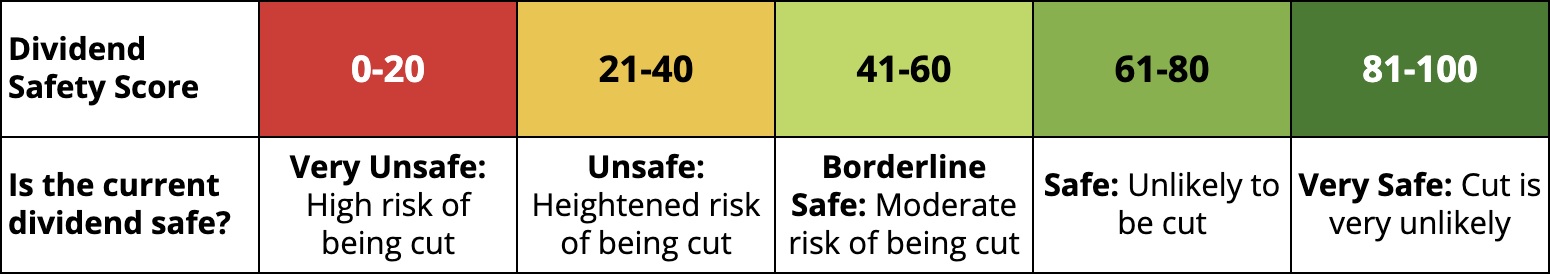
In my portfolio now more than half (51%) of my portfolio is in the Safe and Very Safe category which has very little risk of being cut. Another 25% is Borderline Safe. The remaining 17% are Unsafe or Very Unsafe. 8% are unclassified and have a score of 0. I need to monitor especially the unsafe positions closely.
In October there has been no significant shift between categories.
Dividend Safety Score Stock by Stock
For each individual stock in my portfolio the current score is as follows:
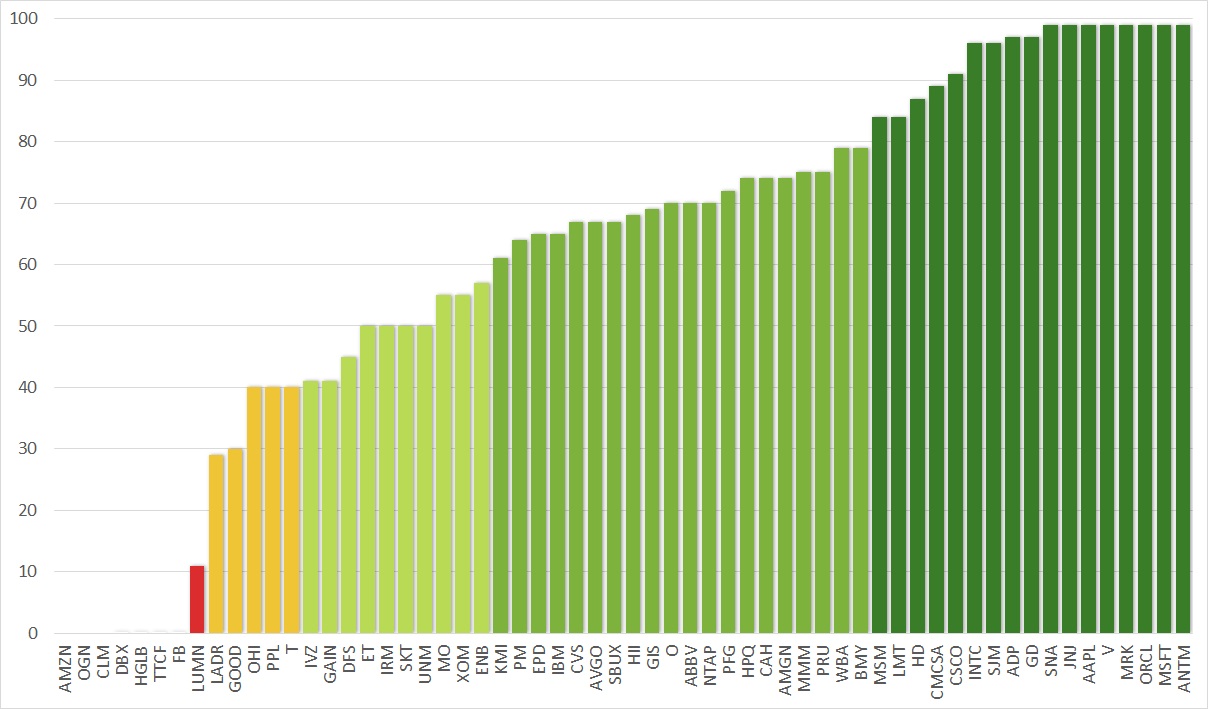
I hold now 17 companies in the highest category of Very Safe, of which 8 actually have the highest score of 99, and another 20 companies is the second highest category Safe. Overall, my portfolio contains many high quality dividend stocks with a safe dividend score.
On the other end we see the red alarming light with LUMN (formerly CTL). It is only a small position and I am not concerned about this one.
LADR as it is my largest position for dividend income and as such gives me the most exposure to a potential dividend cut. PPL is smaller positions and has a risk of a dividend cut. My sell order is placed. Still not sure what to do about T. I will have to monitor closely if there are any negative signs.
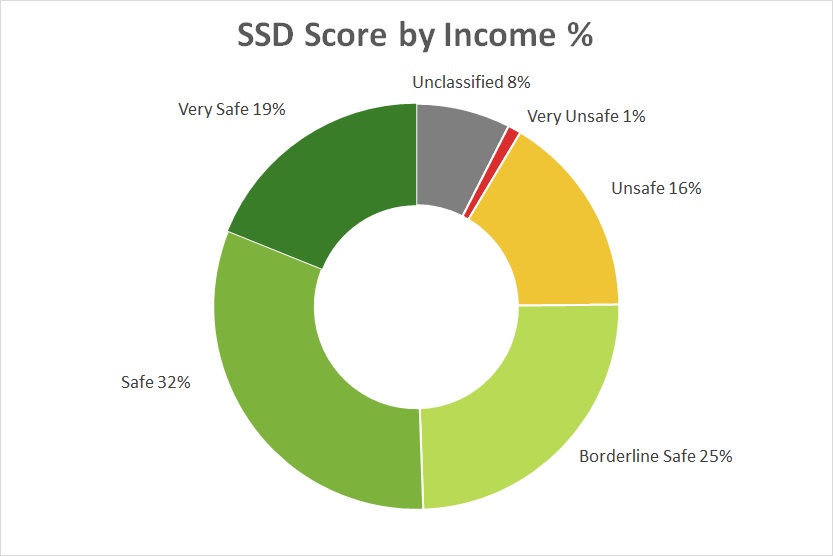
Dividend Safety of Income Distribution
When combining the dividend safety score with the income the picture looks as follows:
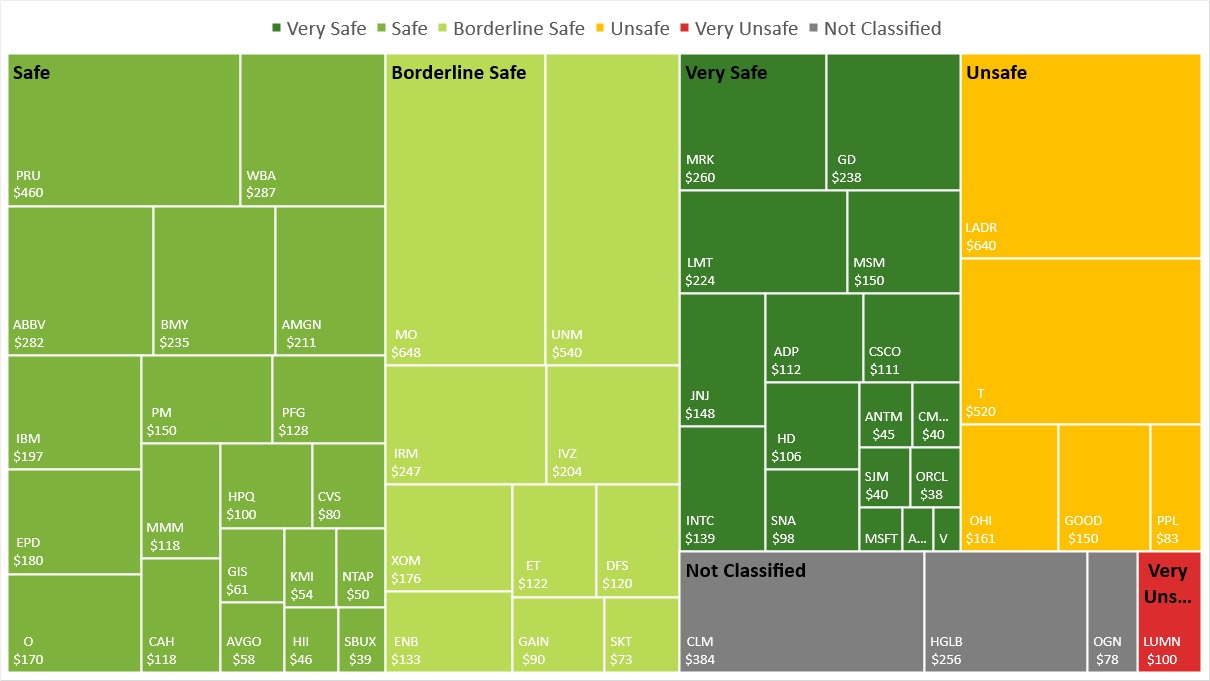
You can see that the largest group has become the Safe category, closely followed by the Borderline Safe one. However, the Very Safe category continues to grow and has become a sizable portion of my portfolio. I am very happy with this and expect this one to grow over time.
With T having in the Unsafe category, its size is substantial. I am still not sure what the best course of action is for this stock: holding or selling. LADR I bought at a very good time and would expect no mayor issues for now.
Dividend Safety and Yield
Another way of looking at the dividend safety is by yield and score. For each of my holdings I compare these values to visualize the figures which clearly lets you draw some general conclusions.
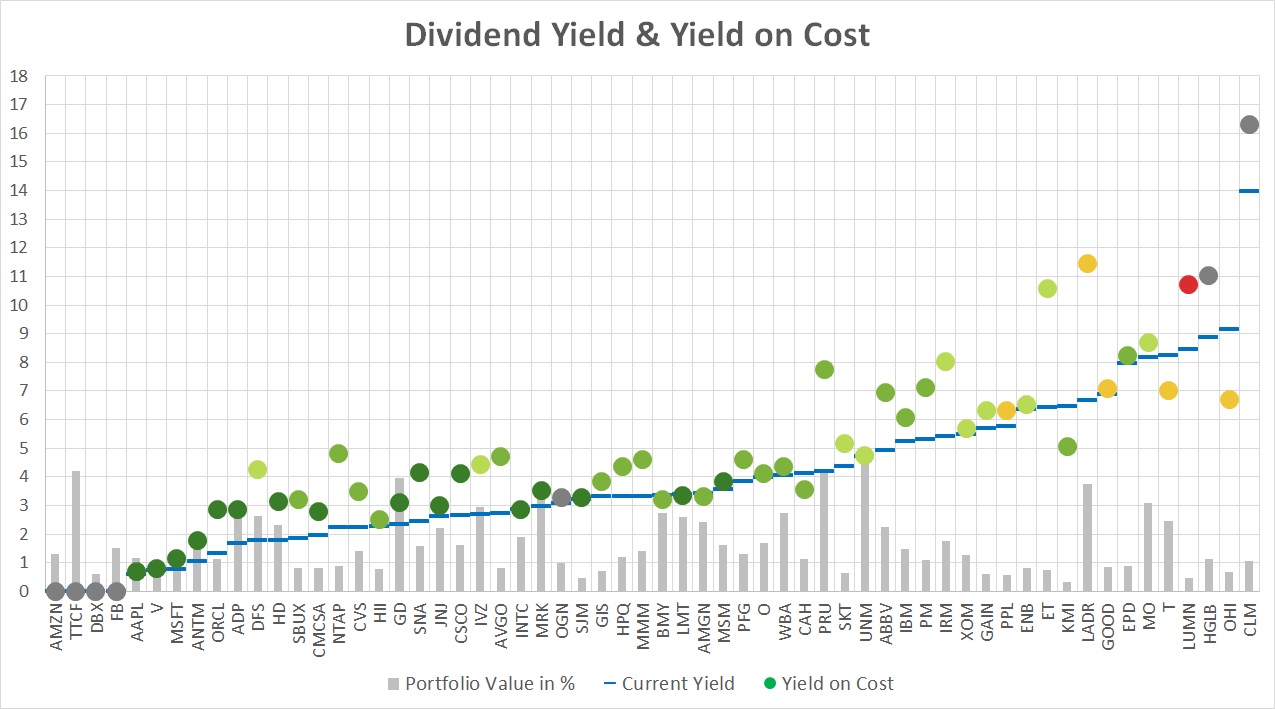
The dots represent my yield-on-cost with the color of the dividend safety score. The blue lines indicate the current yield of these stocks. The grey dots represent companies that either do not pay a dividend or are not covered by SSD. The light grey bars represent the percentage of the stock value in my portfolio.
There is a clear correlation between yield and safety score. On the left hand side (apart from the grey dots) we have the low yield, high safety score companies. The further we go to the right, the lower the dividend safety score becomes but it typically comes with a higher yield.
If the blue line (current yield) is below the dot (yield on cost) it means that either the stock has appreciated in price or the dividend was raised or both. Companies recovered quite nicely after the lows in March 2020 and most of my stocks have a lower current yield than my yield on cost.
On the right hand side you can also see the extreme values that stocks can take on. CLM, HGLB, LUMN, ET and LADR have a yield on cost of above 10%. You might consider OHI enticing with a current yield of just over 9%. However, one of my goals going forward is not to chase the yield as we can so clearly see that it comes with a lot of risk. Still, if I see an opportunity I am open to explore it.
Over time, I would like to see the left zone to experience a push upwards of the dots as dividend increases impact on my yield-on-cost.
At the same time, my continuous adding to the positions typically increases the average cost and lowers the yield-on-cost.
Projected Annual Dividend Income (PADI)
My Projected Annual Dividend Income (PADI) increased to $9,555 in October compared to $9,094 at the end of September. This is a rise of $461 or 5.1%.
In my September report I stated that there was a mismatch between my SSD numbers and my spreadsheet numbers. I figured out that I had not updated the SSD portfolio correctly. The stocks AMGN and SJM were not accounted for. Now everything matches again.
As shown in my purchases section the increase was fueled by gains from options trading deployed into new purchases with $410. The dividend raises added further $55.
My journey continues to invest in high quality dividend growth stocks.. I maintain myself firm to invest in undervalued stocks. However, the voices for a potential crash after a final blow off top rally are increasing and getting louder. I will be cautious to see how the markets evolve.
Portfolio Dividend Yield
The current yield of the shares in my portfolio is 3.72%, an increase of 0.01 points compared to September.
The investment yield for my dividend growth portfolio is 4.60%. For this yield I compare the current dividend income with the purchase price of the underlying shares. A small increase by 0.01 points.
My yield on cost (YoC) is increasing again this month at 5.72%, up 0.15%, because of new dividend and options income as well as further dividend raises.
Conclusion
The dividend income for October was $731.21 from 18 different companies, a 40% increase compared to October last year. My PADI stands at $9,555 and has surpassed my 2021 target of $8,600 by a huge amount.
The dividend safety score of my portfolio is 58.7, an increase of 0.6 points but still significantly below my set target of 70. My analysis has shown that 51% of my dividend income is categorized as safe, but there are still a few stocks with a high risk of being cut.
If you find the information provided helpful and inspiring please consider subscribing to my email list and you will never miss another update. I am also happy to receive comments either on the stocks I hold or other views you want to express. Thank you for having taken the time to read this post.
Disclosure: At time of writing long on all above mentioned
Disclaimer: I am not a professional investment or financial advisor. The information presented on this site represents my personal dividend growth journey and it is for informational purposes only. Opinions expressed are my own and should NOT be relied on or taken as investing advice. I have no knowledge about your personal situation and before you make any investment decision you should exercise due diligence and must do your own research. Always consider seeking advice from a professional financial and tax advisor.
Creo que centrarte en aumentar la calidad de las empresas que compras es un buen punto.
Gracias por tu comentario. Invertir en empresas de alta calidad fue uno de mis aprendizajes de 2020. Lo tengo como linea roja para cualquier inversion.