The month of April is over for quite some time now but I have not been able to get the article out. For my readers I still want to make the effort to show the evolution month by month and hopefully catch up soon.
In April my dividend growth journey portfolio reached a new record dividend income for the month. It surpassed the $700 mark. A total of 19 companies paid me and I received $706.10 in dividends.
I really enjoy looking at all the payments throughout the month. It is a confirmation that I am on the right track. It is a pleasure to see the fruits of your hard work every single month.
It is time to review the earnings of my dividend growth strategy. My April Dividend Income in detail:
Advanced Data Processing (ADP) – income of $27.90
Cardinal Health (CAH) – income of $29.15
Comcast (CMCSA) – income of $10.20
Cisco Systems (CSCO) – income of $27.75
Gladstone Investment Corp (GAIN) – income of $7.00
Gladstone Commercial Corp (GOOD) – income of $12.52
Highland Global Allocation Fund (ETF) (HGLB) – income of $21.30
HP Inc. (HPQ) – income of $9.69
Iron Mountain (IRM) – income of $61.85
Ladder Capital (LADR) – income of $160.00
Medtronic (MDT) – income of $8.69
Altria (MO) – income of $154.80
Merck (MRK) – income of $45.50
MSC Industrial (MSM) – income of $37.50
NetApp (NTAP) – income of $12.00
Realty (O) – income of $14.10
Oracle (ORCL) – income of $9.60
Phillip Morris (PM) – income of $36.00
PPL Corp. (PPL) – income of $20.75
LADR and MO are my main contributors with $160 and $154.80 respectively. MRK has grown significantly ince January as I added more shares. First time contributors are CAH, HGLB and PPL.
Overall, I have a nice split across many of my holdings and reduce the impact of any potential dividend cuts.
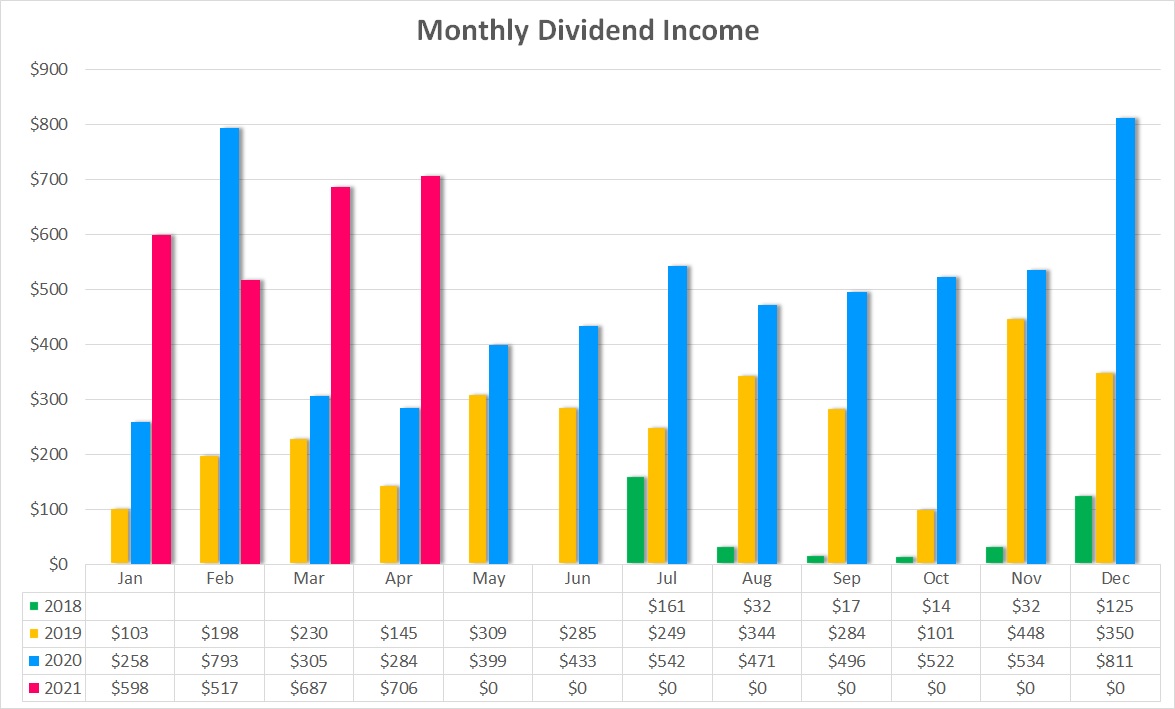
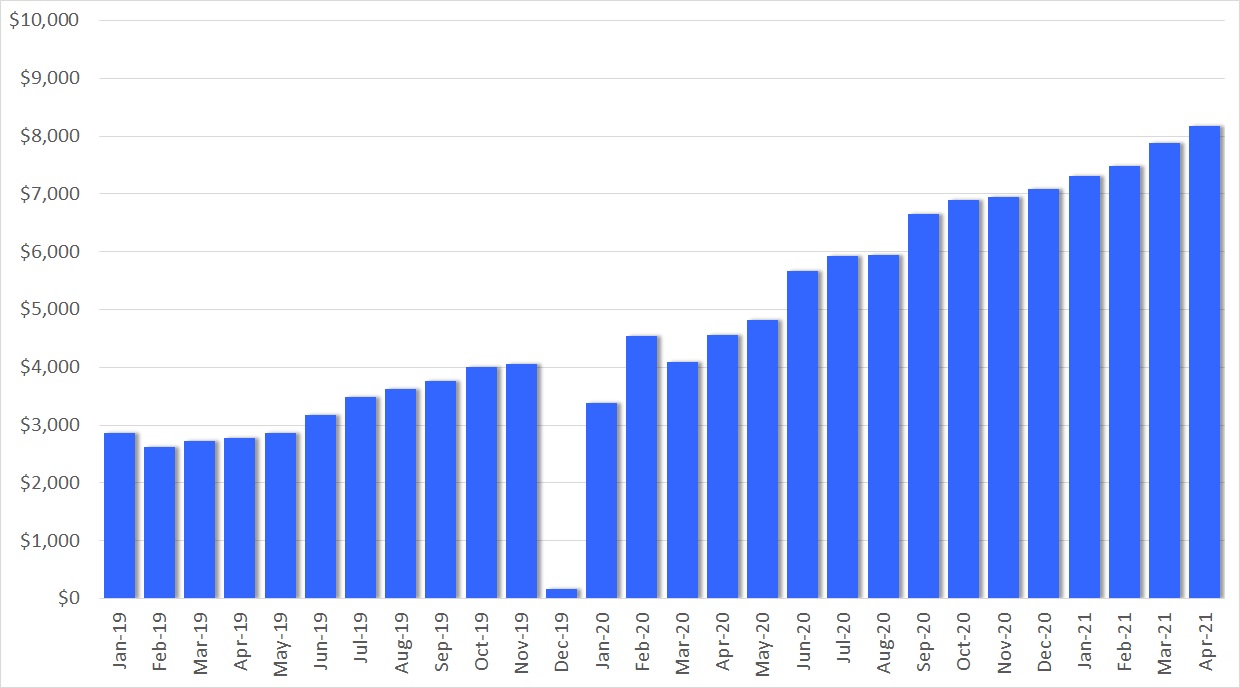
The above chart shows my monthly dividend income over time. In April 2021 I received $706.10 compared to April 2020 with $283.80 of income. This is an increase of $422.30 or 149%. The COVID-19 impact comes to show. I had to sell several shares to cover my options position margin requirements.
However, how things can change in a year. Taken out the special dividends in February 2020 and December 2020, April has been my highest ever dividend income month. Fantastic!
Year over year I managed to increase my income from $1,639.54 in the period January to April 2020 to $2,507.63 in the same period in 2021. That is an increase of $868.09 or 53%.
That’s the way I like it.
Check out my current Dividend Income Table for 2021 and the full overview of all the stocks.
Dividend Changes
In April there have been six dividend increases in my portfolio. The table below summarizes the total impact of $37.90, with an average increase of 5.5%.
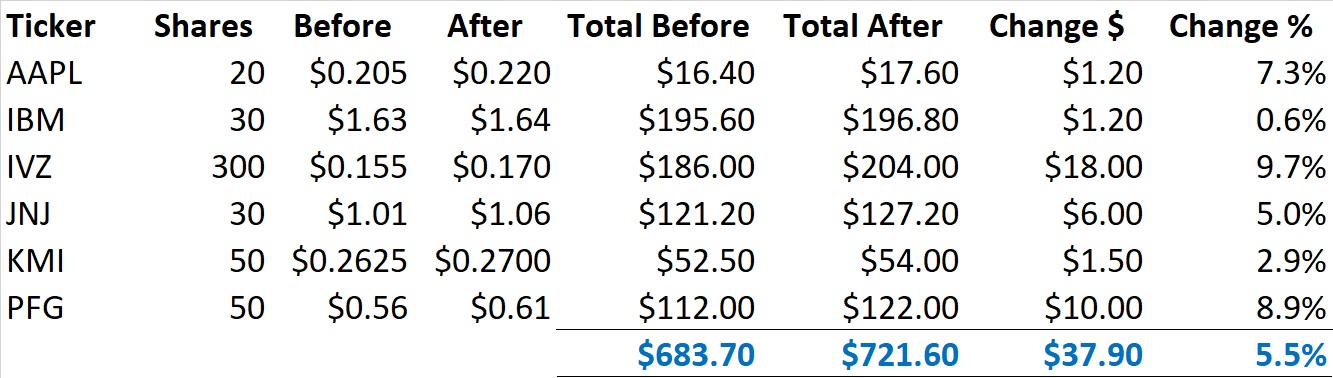
AAPL increased their dividend by 7.3% – slightly below my expectations.
IBM delivered another small increase of 0.6%. Not a lot of growth here.
IVZ raised their divided by 9.7% which was just what I was expecting.
JNJ added another increase of 5.0% to their dividend. Steady on!
KMI did raise their dividend by 2.9%. I did not expect that. Then again the outlook for oil and gas is rather positive.
PFG increased their dividend by 8.9% – I could not ask for more.
As a result of this change, my PADI increased by $37.90. At a yield of 3.0%, to achieve this dividend income I would have to deploy $1,263. But this is not necessary. The dividend increases take care of that and that’s the beauty of dividend growth investing and the compound effect in action.
Expected Dividend Increases for May
As we are already in June as I just did not get around to write this article earlier, I will skip this section.
The Dividend Growth Portfolio
In the Dividend Growth Portfolio I hold 58 different companies. Here is an overview of the status as of April 30th.
Purchases
In April I added one new position to my dividend growth portfolio and grew another position further. Surely the overall market is richly valued but my main focus is to only invest in undervalued stock to use that margin of safety. Additionally, I invest selectively into growth stocks.
Highland Global Allocation Fund (HGLB)
The Global Allocation Fund is a closed-end fund designed to provide low correlation to U.S. equity market. It invests primarily in U.S. and foreign equity and debt securities that the portfolio manager considers to be undervalued by the market but have solid growth prospects.
Tattooed Chef Inc (TTCF)
Tattooed Chef Inc is a plant-based food company offering a broad portfolio of plant-based food products that taste great and are sustainably sourced. The company’s signature products include ready-to-cook bowls, zucchini spirals, riced cauliflower, acai and smoothie bowls, and cauliflower pizza crusts, which are available in the frozen food sections of national retail food stores across the United States. Tattooed Chef provides great-tasting, approachable, and innovative products not only to the growing group of consumers who seek to adopt a plant-based lifestyle, but to any of the People Who Give a Crop. Tattooed Chef was founded in 2018 and is headquartered in Paramount, California.
These are the companies/funds I invested in this month. I wanted to explore alternative investments and put my foot into the door. The Highland Global Allocation Fund (HGLB) is my first closed-end fund. I bought 300 shares because as the Net Asset Value is significantly above the current price. It pays a dividend of $0.071 on a monthly basis. As a result, I have added $255.00 of dividend income to my Projected Annual Dividend Income (PADI). On an investment amount of $2,317.95 including fees it comes to an average dividend yield of 11.00%. That’s right! This is what is so intriguing about this type of investment. There is not SSD score.
I added significantly to my position in Tattooed Chef (TTCF) as the price dropped and hold now 600 shares. This company has become a top-5 position in my portfolio but does not pay a dividend. This is a pure growth stock.
Sales
There has been no stock sale in April.
Check out my current Dividend Growth Portfolio and the full overview of all the stocks I hold in it.
Dividend Safety
One of the key metrics for my future passive income is how safe it is. For this reason I have started to track my Dividend Safety Score. For this score I use the weighted dividend safety punctuation from Simply Save Dividends combined with the dividend income of each of my stocks. The higher the score the safer the dividend income.
Dividend Safety Score
For April, the Dividend Safety Score is 60.8 for my dividend growth portfolio and has dropped from 62.8 compared to February.
This decrease is due to the deployment of money into the Highland Global Allocation Fund which is not scored and, hence, has a score of 0 assigned.
I consider the score of below 60 somewhat at the lower acceptable end and my target is a score of 70. I want to have achieved this by the end of 2021. My plan is not to sell low rated stocks but instead re-balance to high scoring ones when deploying more money. Surely for April I deviated from this plan.
I strive to continuously add to my portfolio and here really the focus is on high quality stocks. The re-balancing happens over time as new money deployed lowers the proportion of the low scoring stocks. I have seen that this works just fine for other dividend growth investor portfolios.
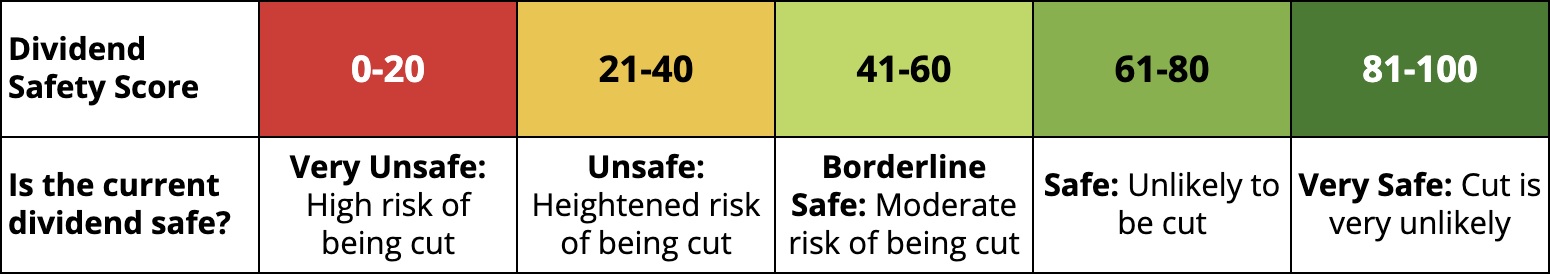
Let’s look at the actual distribution. I use the same classification as Simply Safe Dividends as it makes it easy to spot the categories. You see that the unclassified category has increased quite a bit.
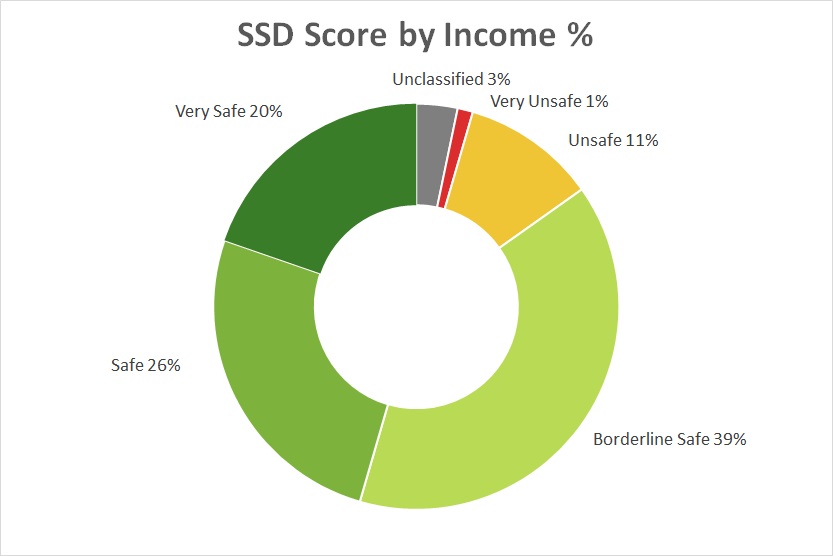
The different categories and their respective score ranges from very unsafe to very safe are:
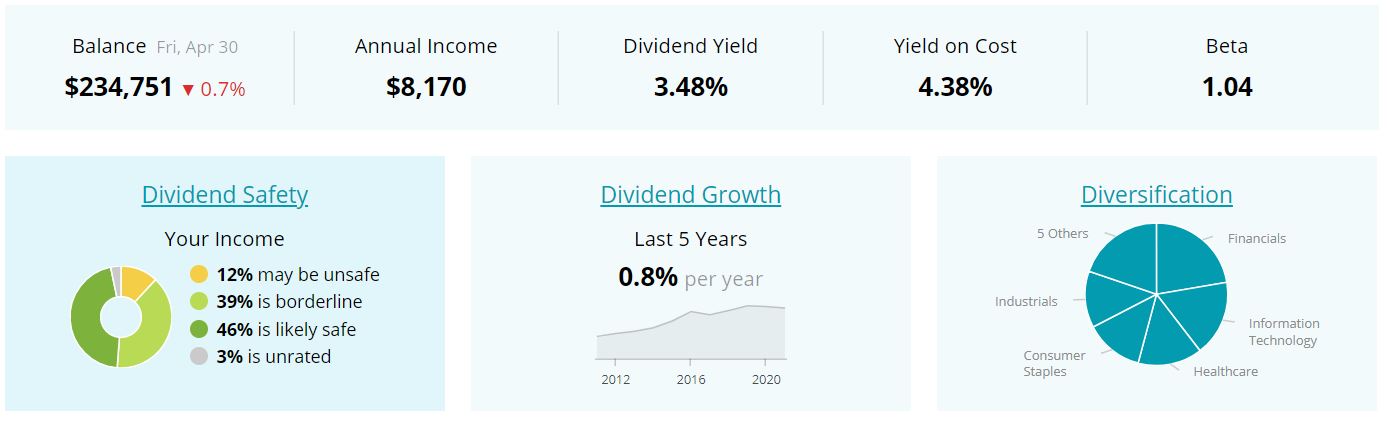
In my portfolio 46% is in the Safe and Very Safe category which has very little risk of being cut. Another 39% is Borderline Safe. The remaining 12% are Unsafe or Very Unsafe. 3% are unclassified and have a score of 0. I need to monitor especially the unsafe positions closely.
In April there has been no significant shift between categories.
Dividend Safety Score Stock by Stock
For each individual stock in my portfolio the current score is as follows:
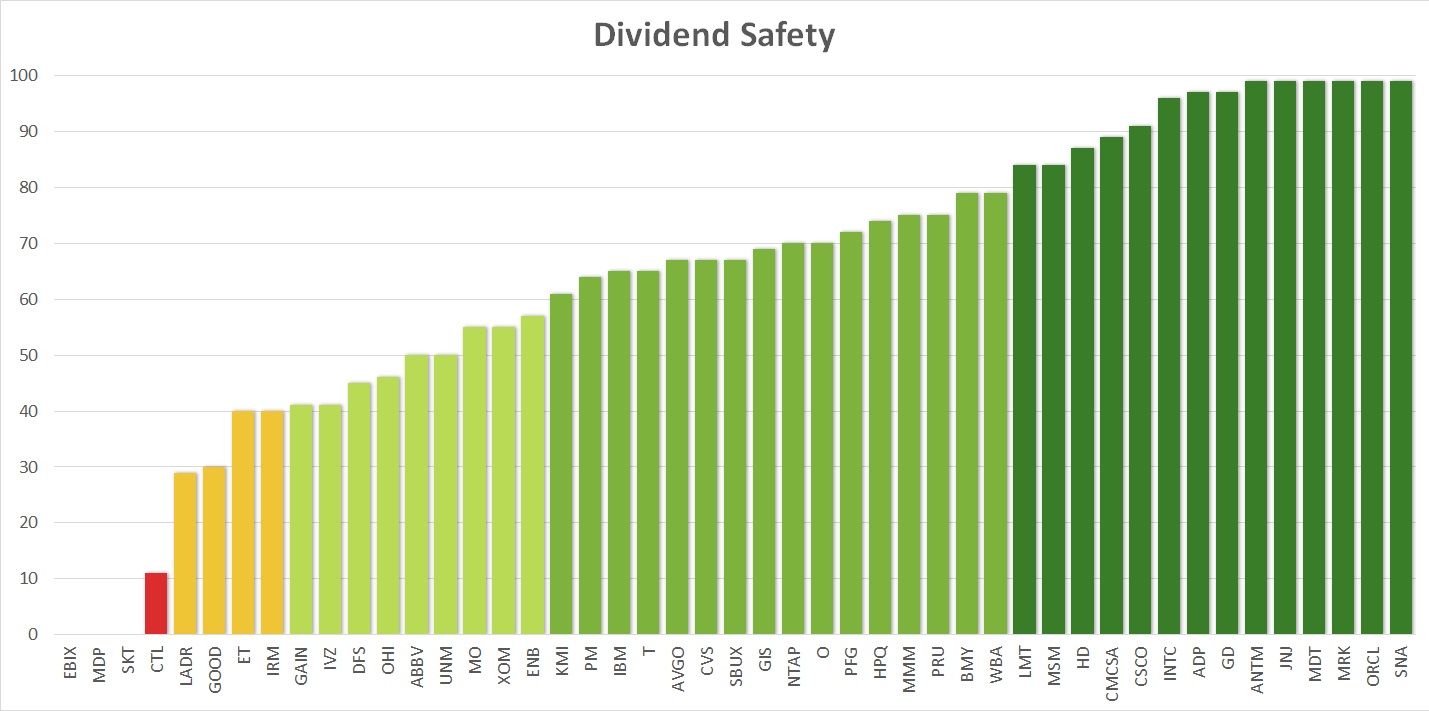
I hold now 17 companies in the highest category of Very Safe, of which 9 actually have the highest score of 99, and another 16 companies is the second highest category Safe. Overall, my portfolio contains many high quality dividend stocks with a safe dividend score.
On the other end we see the red alarming light with LUMN (formerly CTL). It is only a small position and I am not concerned about this one.
LADR as it is my largest position for dividend income and as such gives me the most exposure to a potential dividend cut. GOOD and PPL are also smaller positions and do not require any further attention. I will have to monitor closely if there are any negative signs.
Dividend Safety of Income Distribution
When combining the dividend safety score with the income the picture looks as follows:
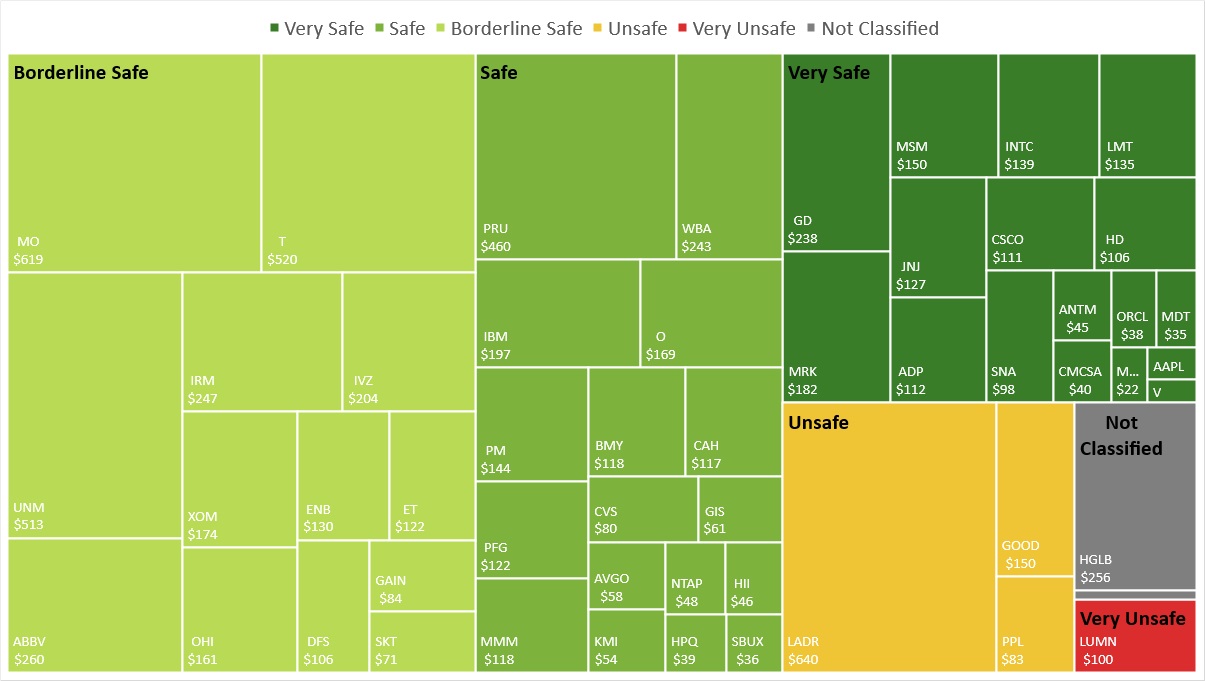
You can see that the largest group remains the Borderline Safe category, closely followed by the Safe one. However, the Very Safe category has become a sizable portion of my portfolio. I am very happy with this and expect this one to grow over time.
Dividend Safety and Yield
Another way of looking at the dividend safety is by yield and score. For each of my holdings I compare these values to visualize the figures which clearly lets you draw some general conclusions.
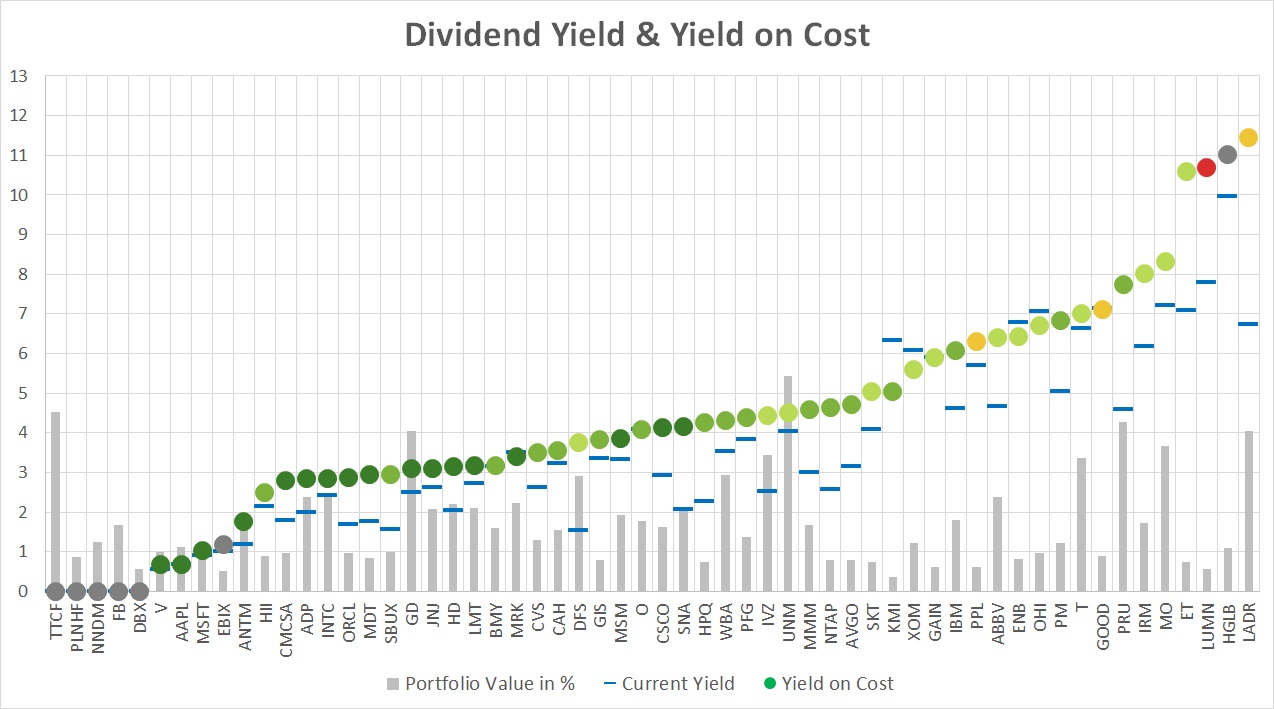
The dots represent my yield-on-cost with the color of the dividend safety score. The blue lines indicate the current yield of these stocks. The grey dots represent companies that either do not pay a dividend or are not covered by SSD. The light grey bars represent the percentage of the stock value in my portfolio.
There is a clear correlation between yield and safety score. On the left hand side (apart from the grey dots) we have the low yield, high safety score companies. The further we go to the right, the lower the dividend safety score becomes but it typically comes with a higher yield.
If the blue line (current yield) is below the dot (yield on cost) it means that either the stock has appreciated in price or the dividend was raised or both. Companies recovered quite nicely after the lows in March 2020 and most of my stocks have a lower current yield than my yield on cost.
On the right hand side you can also see the extreme values that stocks can take on. ET and LADR have still a yield on cost of above 10%, even after the dividend cuts. My new position HGLB has placed itself right between the two. However, one of my goals going forward is not to chase the yield as we can so clearly see that it comes with a lot of risk. Still if I see an opportunity I am open to explore it.
Projected Annual Dividend Income (PADI)
My Projected Annual Dividend Income (PADI) increased to $8,170 in April compared to $7,877 at the end of March. This is a rise of $293 or 3.7%.
In large the increase was fueled by newly deployed money with $255 and further $38 by dividend raises.
My journey continues to invest in high quality dividend growth stocks. However, the stock market shows less and less opportunities. I maintain myself firm to invest in undervalued stocks. However, this month I focused on alternative investment options like a closed-end fund and a pure growth stock.
At the same time, I try to boost my returns by selling options. I also give a monthly Options update. Check out my latest one here.
For my target of $8,600 for this year I am very well on the way of reaching it early. It only took me four months to go from $7,092 to $8,170 which is an increase of $1,078 in total or $270 per month. In order to hit my target I planned for $126 per month on average. This means this year I am racing at twice the pace originally planned.
Portfolio Dividend Yield
The current yield of the shares in my portfolio is 3.48%, a decrease of 0.12 compared to last month. A result of my investment into TTCF with no dividends.
The investment yield for my dividend growth portfolio is 4.38%, a decrease of 0.09 compared to March. For this yield I compare the current dividend income with the purchase price of the underlying shares.
My yield on cost (YoC) is higher this month at 5.17%, up 0.14%, because of new dividend and option income as well as further dividend raises.
Conclusion
The dividend income for March was $706.10 from 19 different companies, a 149% increase compared to March last year. My PADI stands at $8,170 and has surpassed the $8,000 mark for the first time.
The dividend safety score of my portfolio is 60.8, a drop of two points over March and still significantly below my set target of 70 for the end of the year 2021. My analysis has shown that 46% of my dividend income is categorized as safe, but there are still a few stocks with a high risk of being cut.
If you find the information provided helpful and inspiring please consider subscribing to my email list and you will never miss another update. I am also happy to receive comments either on the stocks I hold or other views you want to express. Thank you for having taken the time to read this post.
Disclosure: At time of writing long on all above mentioned except for MDT which I sold in May
Disclaimer: I am not a professional investment or financial advisor. The information presented on this site represents my personal dividend growth journey and it is for informational purposes only. Opinions expressed are my own and should NOT be relied on or taken as investing advice. I have no knowledge about your personal situation and before you make any investment decision you should exercise due diligence and must do your own research. Always consider seeking advice from a professional financial and tax advisor.