The first two months of 2021 continue like a roller coaster and market volatility (VIX) is still very high. Luckily dividends take out some of this volatility and deliver a steady income stream month after month.
What does this look like for me in February? A total of 14 companies paid me and I received $516.53 in dividends.
Even though my PADI is already well over $7,200 which should pay me an average of at least $600 per month, the truth is that for one I do not focus on having an equal payout for each month and rather focus on adding high quality dividend growth stocks when they are undervalued as well as some company tend to shift their payment dates from one month to another. In January I was already paid by MSM and SBUX decided to pay only in March.
So minor ups and downs do not bother me the least. My dividend income has been growing steadily over the last few months as I keep deploying more and more capital. It is a pleasure to see the fruits of your hard work every single month. The general trend is pointing upwards.
It is time to review the earnings of my dividend growth strategy. My February Dividend Income came from:
Apple (AAPL) – income of $4.10
AbbVie (ABBV) – income of $65.00
Bristol-Myers Squibb Co (BMY) – income of $9.80
CVS Health (CVS) – income of $20.00
Energy Transfer (ET) – income of $30.50
Gladstone Investment Corp (GAIN) – income of $7.00
General Dynamics (GD) – income of $55.00
General Mills (GIS) – income of $15.30
Gladstone Commercial Corp (GOOD) – income of $12.52
KinderMorgan (KMI) – income of $13.13
Realty (O) – income of $14.07
Omega Health Care (OHI) – income of $20.10
Tanger Factory Outlet Centers (SKT) – income of $17.76
AT&T (T) – income of $104.00
Unum Group (UNM) – income of $128.25
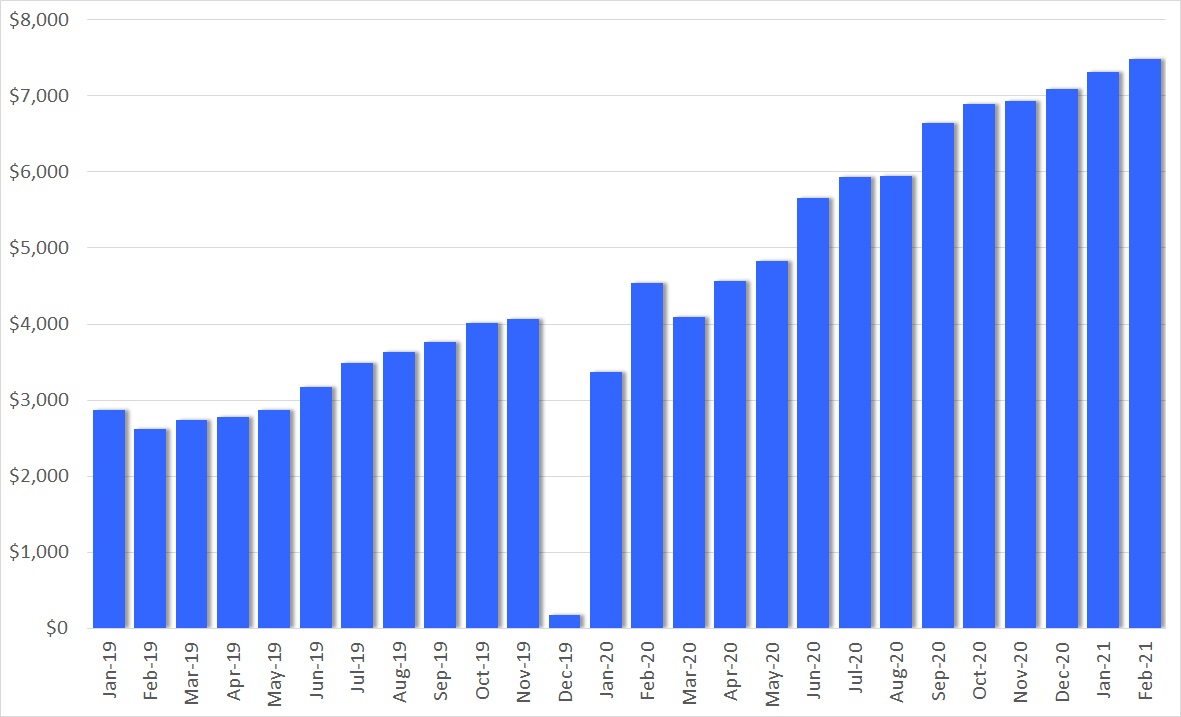
T and UNM are my main contributors with $104 and $128.25 respectively. I may add some more T to my portfolio as it has still a very nice 7% dividend yield. UNM has become my biggest position in my portfolio after the recovery and I consider that there is still quite some more potential from a P/E mean reversion perspective.
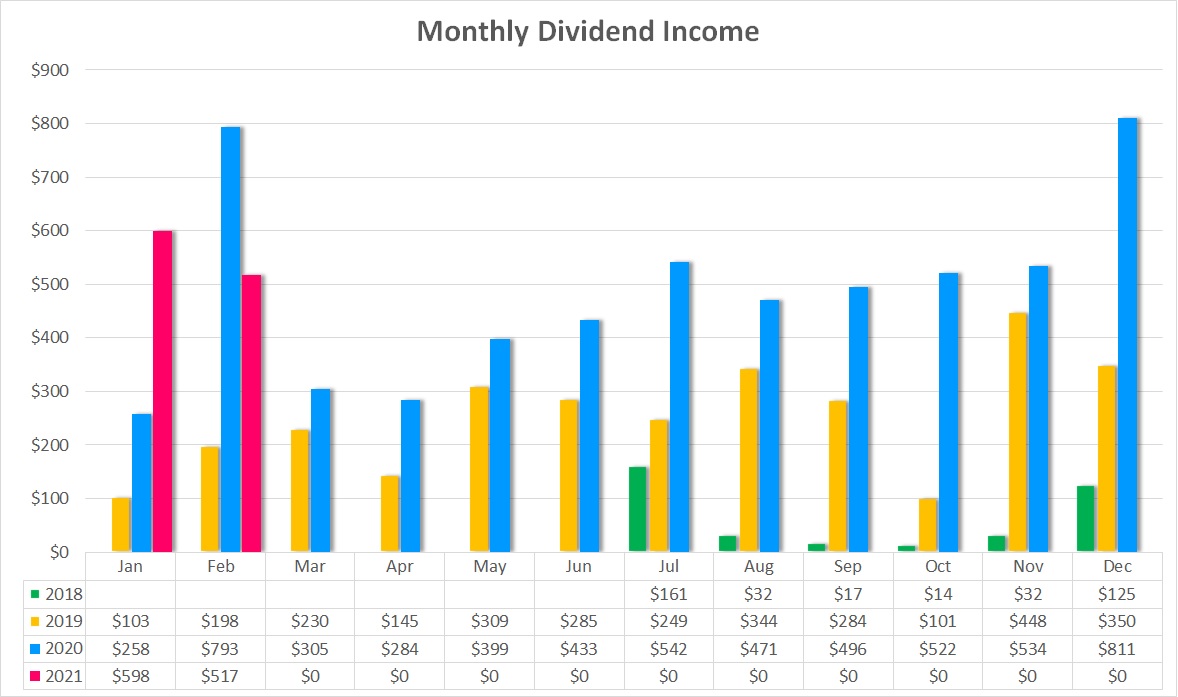
The above chart shows my monthly dividend income over time. In February 2021 I received $516.53 compared to February 2020 with $792.75 of income. This is a decrease of $276.22 or -35%. Even if I take out the special dividend paid last year by MSM of $250 I still show a small drop.
There are several reasons. Firstly, before the Corona market crash I was heavily invested into high-paying dividend stocks and after the market drop and having to sell a significant amount of shares to cover my options positions, I shifted into more high quality dividend growth stocks which were at a deep discount but typically also with a lower yield. Secondly, as mentioned in the first part of the article, some companies decided to pay earlier or later so that February came out loosing.
February came still higher in than last year’s May and August so I am not concerned.
Check out my current Dividend Income Table for 2021 and the full overview of all the stocks.
Dividend Changes
In February there have been four dividend increases in my portfolio. The table below summarizes the total impact of $33.80, with an average increase of 4.1%.
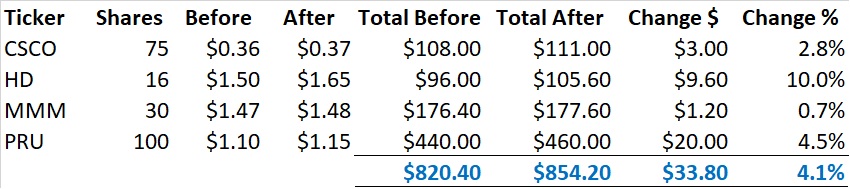
CSCO increased their dividend by 2.8% – not really more can be expected at this moment.
HD showed a very respectable increase of 10.0% which I am happy with.
MMM really has let me down. A 0.7% increase is not something I would expect from a company like MMM. I sure hope they will compensate next year.
PRU has been a little bit more prudent this year and only raised the dividend by 4.5%, a reasonable increase.
I am looking to receive an average increase of 7% to outrank inflation by a large margin. Hence, February has not met that goal with 4.1%.
As a result of this change, my PADI increased by $33.80. At a yield of 3.0%, to achieve this dividend income I would have to deploy $1,127. But this is not necessary. The dividend increases take care of that and that’s the beauty of dividend growth investing.
Expected Dividend Increases for March
The following companies in my dividend growth portfolio have raised their dividend typically in March:
General Dynamics (GD) – I would expect another 8% increase in 2021
Oracle (ORCL) – there was no dividend increase last year but March would be the expected month for this to happen. Are they willing to raise them this year?
The Dividend Growth Portfolio
In the Dividend Growth Portfolio I hold 58 different companies. Here is an overview of the status as of February 28th.
Purchases
In February I opened two new positions and added to an existing one. Surely the overall market is richly valued but my main focus is to only invest in undervalued stock to use that margin of safety. Additionally, after such a market run up boring dividend growth stock tend to outperform the shiny growth stocks.
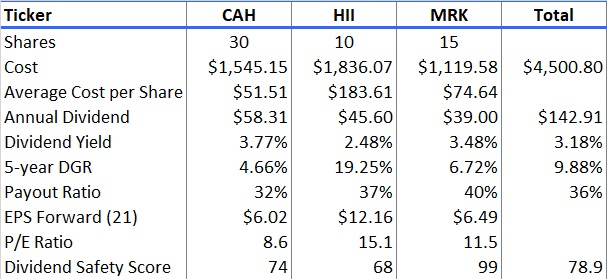
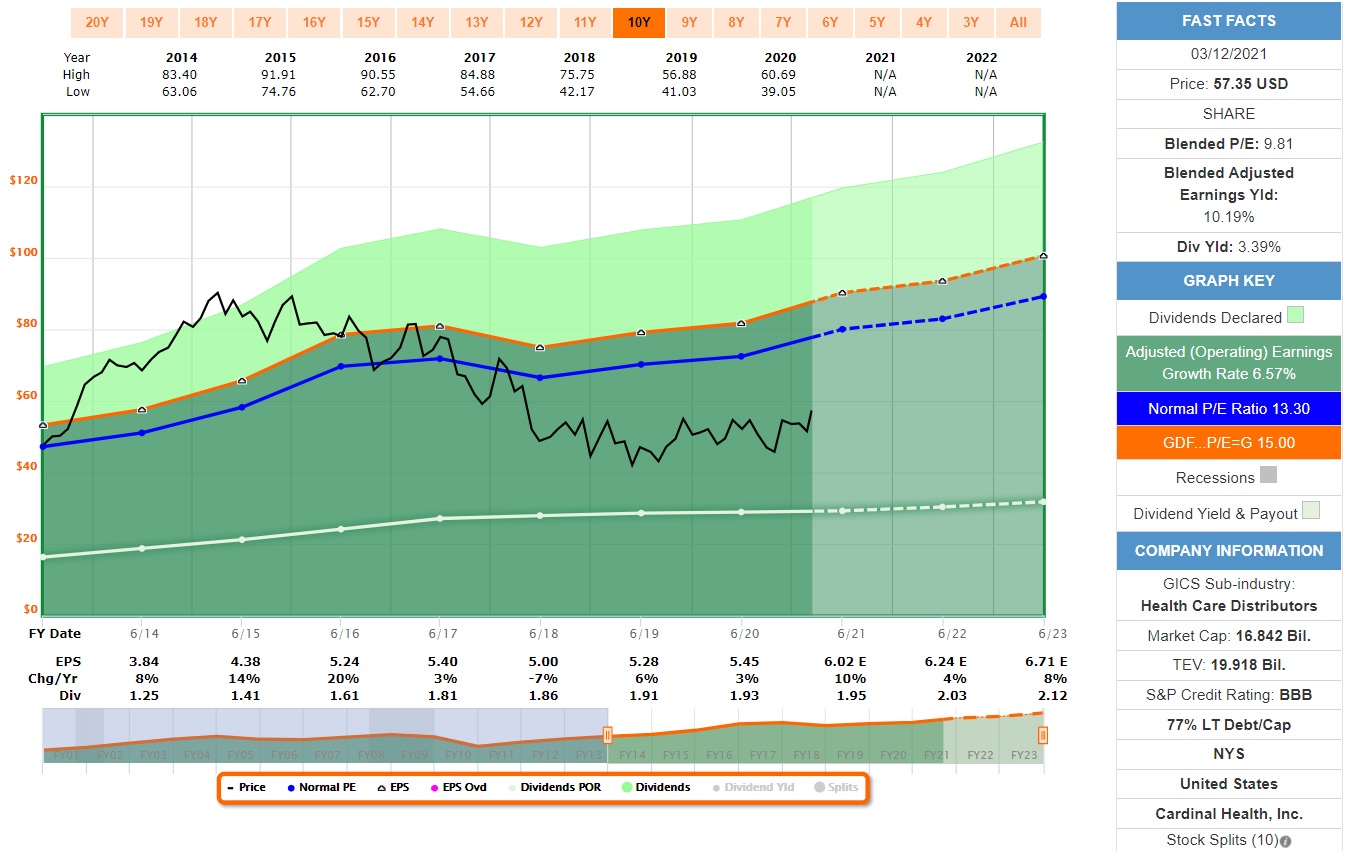
Cardinal Health Inc (CAH)
Cardinal Health Inc is the third- largest global logistics provider engaged in wholesale pharmaceutical and medical products. Similar to the other two peers, the company has evolved over time and has become entrenched in the sourcing and distribution of brand-name and generic pharmaceuticals and related services to hospitals, healthcare systems, pharmacies, ambulatory surgery centers, clinical laboratories, and physician offices. Through acquisitions, Cardinal Health has the ability to manufacture commodity products and certain medical devices.
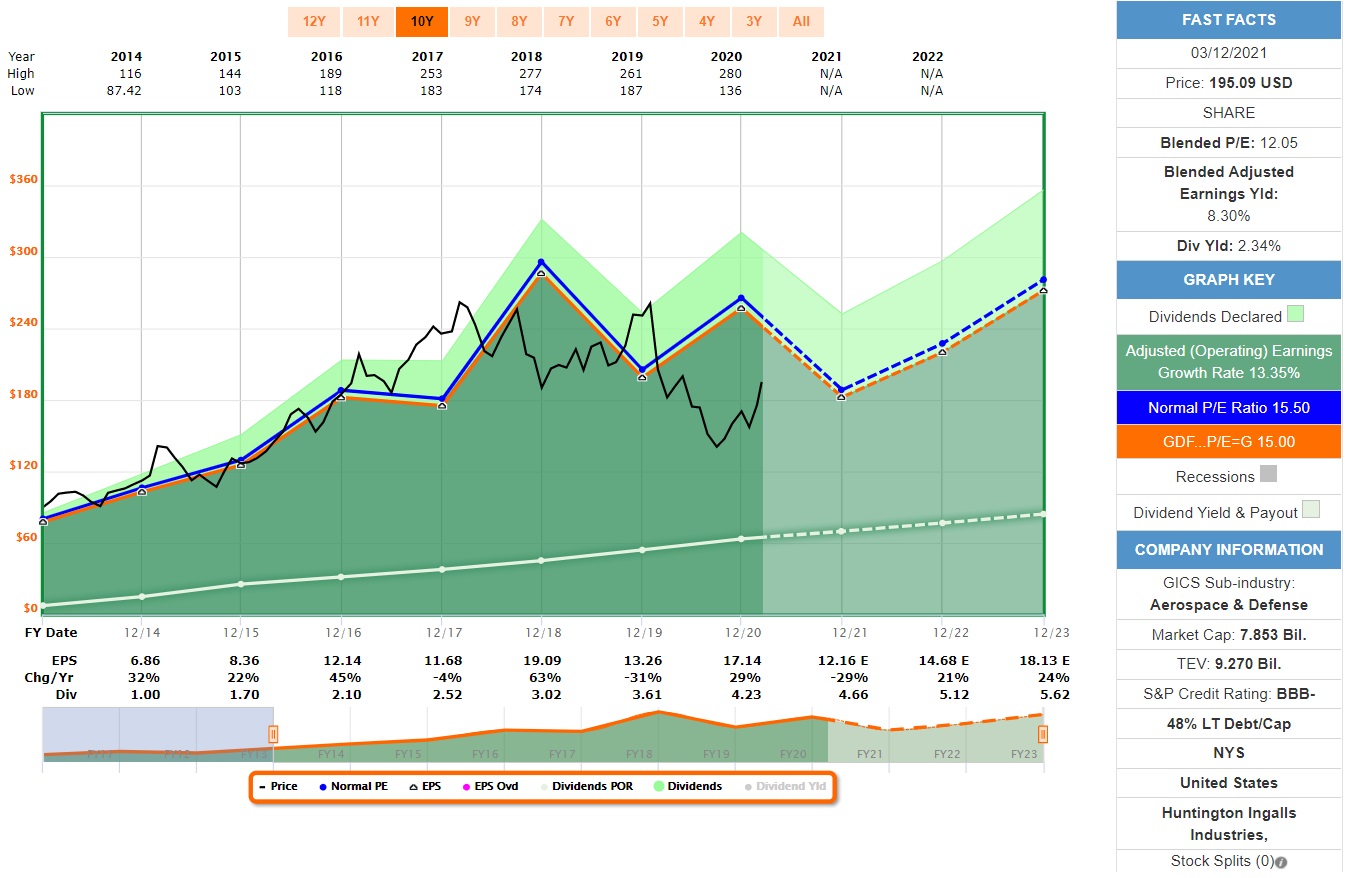
Huntington Ingalls Industries Inc (HII)
Huntington Ingalls Industries Inc was created from the spin-off of Northrop Grumman’s shipbuilding business. The company is the largest independent military shipbuilder. Ingalls produces non-nuclear-powered ships, particularly the America-class amphibious assault ship and the Arleigh Burke-class destroyer. The Newport News segment produces nuclear-powered ships, is the sole-source contractor for the Gerald R. Ford-class aircraft carrier, and is a major subcontractor to the Columbia-class attack submarine. The company’s technical solutions segment produces uncrewed undersea vehicles as well as provides various IT services for the government.
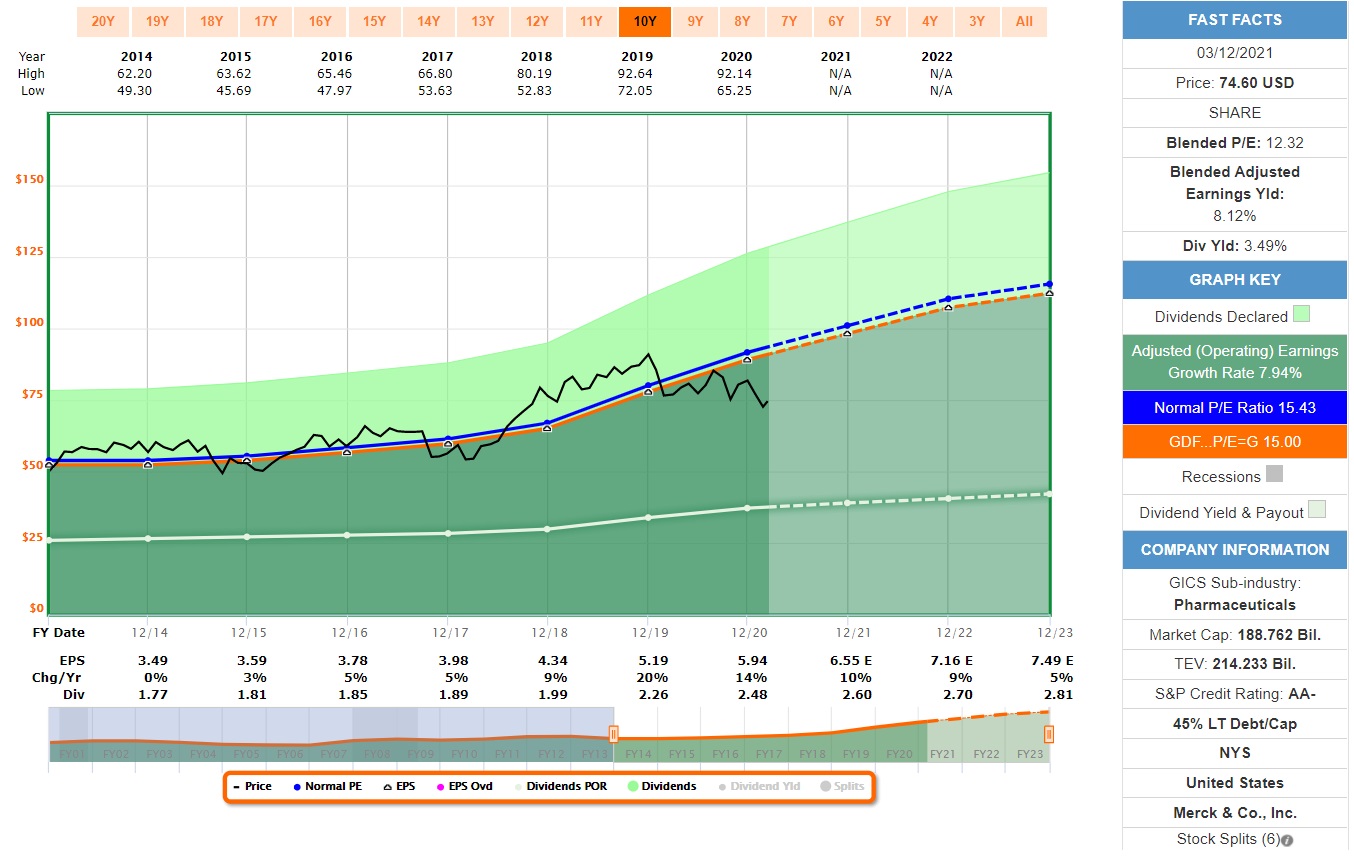
Merck & Co Inc (MRK)
Merck makes pharmaceutical products to treat several conditions in a number of therapeutic areas, including cardiometabolic disease, cancer, and infections. Within cancer, the firm’s immuno-oncology platform is growing as a major contributor to overall sales. The company also has a substantial vaccine business, with treatments to prevent hepatitis B and pediatric diseases as well as HPV and shingles. Additionally, Merck sells animal health-related drugs. From a geographical perspective, close to 40% of the firm’s sales are generated in the United States.
These are the companies I invested in this month. As a result, I have added $142.91 of dividend income to my PADI. On an investment amount of $4,500.80 including fees it comes to an average dividend yield of 3.18% and a weighted Dividend Safety Score of 78.9 points. The Dividend Safety Score is well above my target of 70. Typically, the higher the Dividend Safety Score the lower the dividend yield.
Check out my current Dividend Growth Portfolio and the full overview of all the stocks I hold in it.
Dividend Safety
One of the key metrics for my future passive income is how safe it is. For this reason I have started to track my Dividend Safety Score. For this score I use the weighted dividend safety punctuation from Simply Save Dividends combined with the dividend income of each of my stocks. The higher the score the safer the dividend income.
Dividend Safety Score
For February, the Dividend Safety Score is 62.8 for my dividend growth portfolio, an increase of 0.9 points over January.
An increase is due to the deployment of money into stocks with a higher than previous average score and the raises of dividends. At the same time, some stocks in my portfolio received a dividend safety score raise. Both, ET and IRM were increased from 40 to 50 changing category from Unsafe to Borderline Safe.
I consider the score of below 60 somewhat at the lower acceptable end and my target is a score of 70. I want to have achieved this by the end of 2021. My plan is not to sell low rated stocks but instead re-balance to high scoring ones when deploying more money.
I strive to continuously add to my portfolio and here really the focus is on high quality stocks. The re-balancing happens over time as new money deployed lowers the proportion of the low scoring stocks. I have seen that this works just fine for other dividend growth investor portfolios.
Let’s look at the actual distribution. I use the same classification as Simply Safe Dividends as it makes it easy to spot the categories.
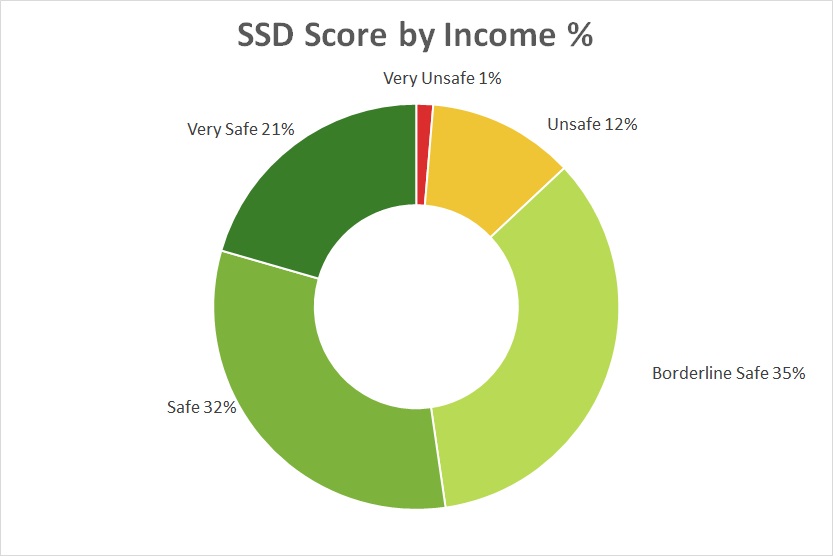
The different categories and their respective score ranges from very unsafe to very safe are:
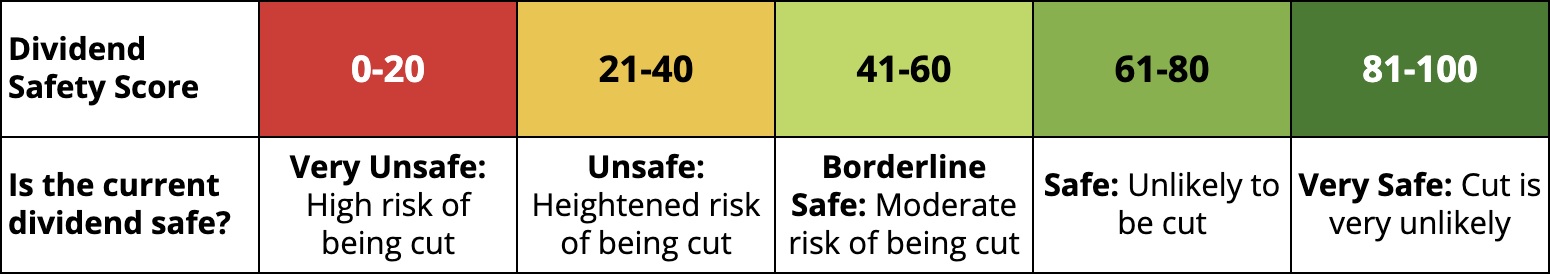
In my portfolio 53% is in the Safe and Very Safe category which has very little risk of being cut. Another 35% is Borderline Safe. The remaining 13% are Unsafe or Very Unsafe. I need to monitor especially the unsafe positions closely.
In February there has been a significant shift from Unsafe (-5.3%) to Borderline Safe (+4.2%). This is mainly due to the above mentioned increase of dividend safety scores for ET and IRM. I am particularly happy to see IRMs score increase as the transition in their business model should generate more future revenue and as such the dividend should not be at risk. In conclusion, the dividend income of my portfolio is to a large percentage safe.
For each individual stock in my portfolio the current score is as follows:
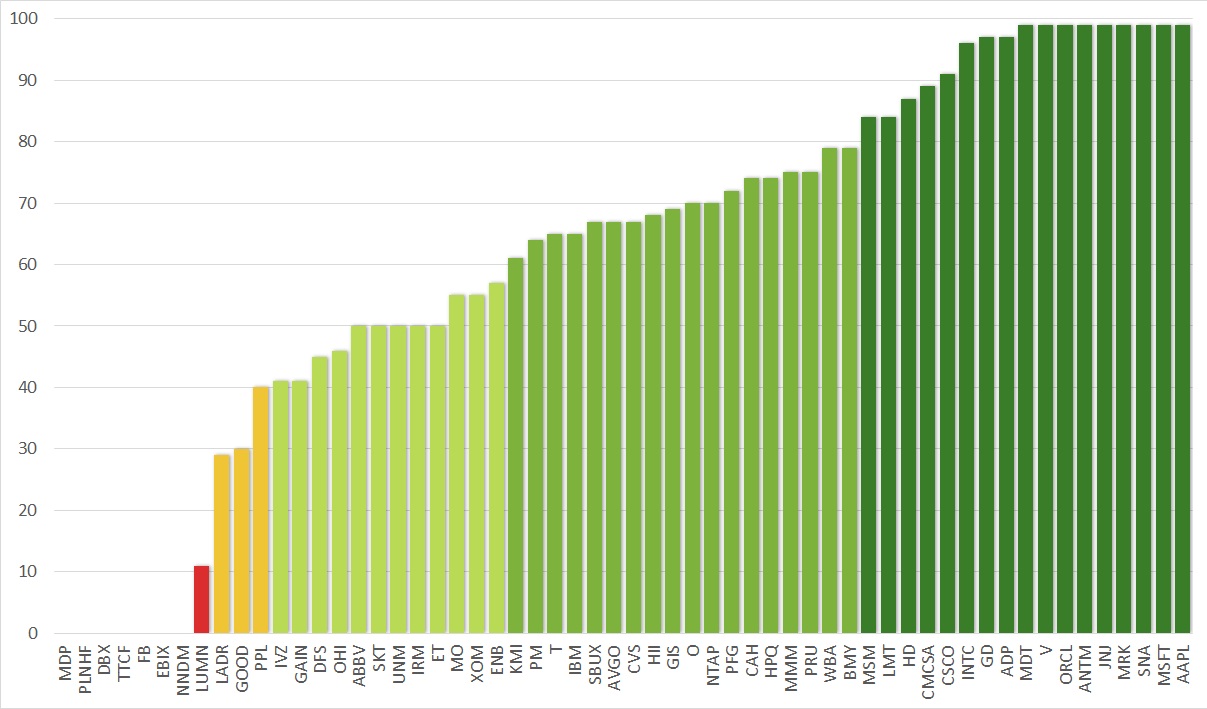
I hold now 17 companies in the highest category, of which 9 actually have the highest score of 99, and another 18 companies is the second highest category. Overall, my portfolio contains many high quality dividend stocks with a safe dividend score.
On the other end we see the red alarming light with LUMN (formerly CTL). Luckily this is only a small position and I have also a sold option which boosts the return. I am not concerned about this one.
LADR as it is my largest position for dividend income and as such gives me the most exposure to a potential dividend cut. GOOD and PPL are also smaller positions and do not require any further attention. I will have to monitor closely if there are any negative signs.
When combining the dividend safety score with the income the picture looks as follows:
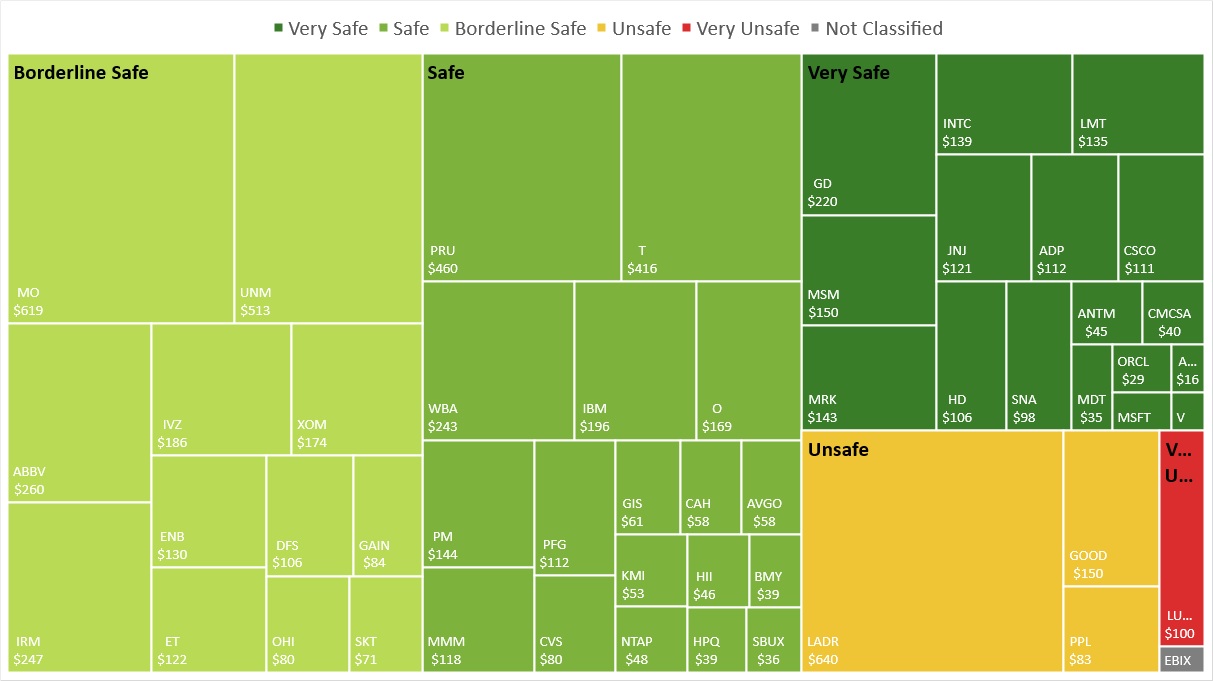
You can see that now the largest group is the Borderline Safe category, closely followed by the Safe one. However, the Very Safe category has become a sizable portion of my portfolio. I am very happy with this and expect this one to grow over time.
Another way of looking at the dividend safety is by yield and score. For each of my holdings I compare these values to visualize the figures which clearly lets you draw some general conclusions.
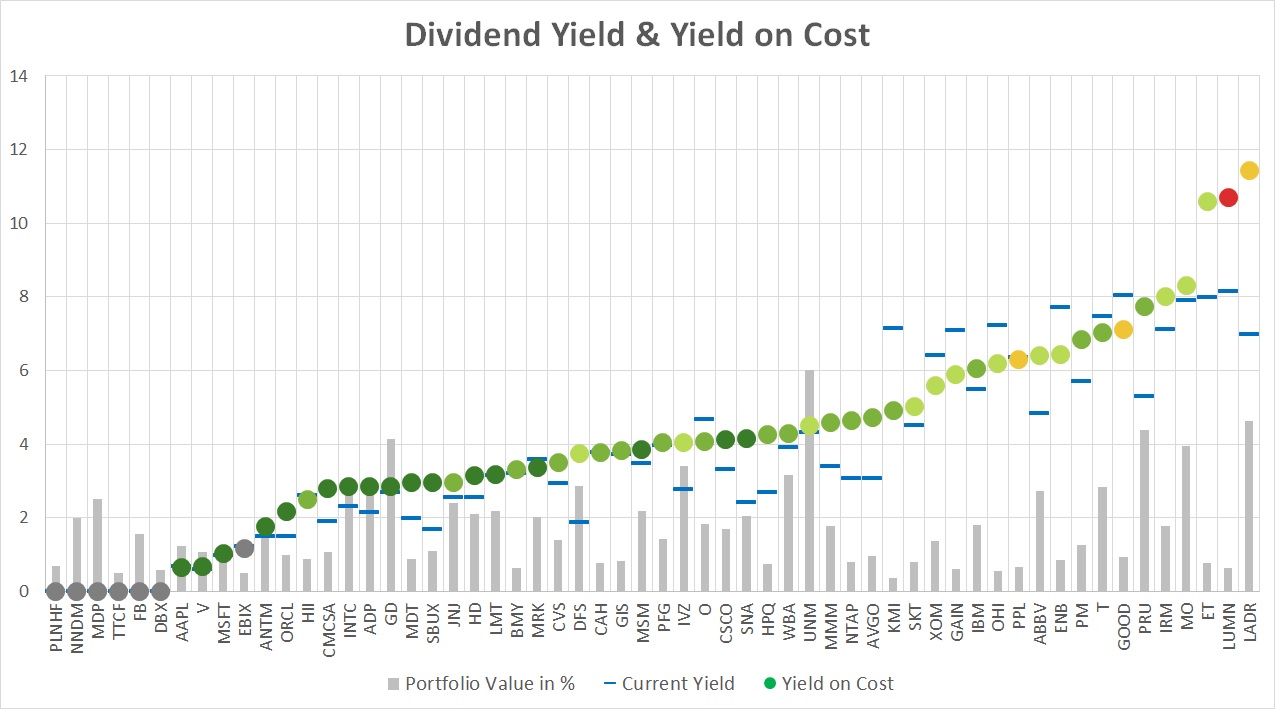
The dots represent my yield-on-cost with the color of the dividend safety score. The blue lines indicate the current yield of these stocks. The grey dots represent companies that either do not pay a dividend or are not covered by SSD. The light grey bars represent the percentage of the stock value in my portfolio.
There is a clear correlation between yield and safety score. On the left hand side (apart from the grey dots) we have the low yield, high safety score companies. The further we go to the right, the lower the dividend safety score becomes but it typically comes with a higher yield.
In the midst of the market crash in March 2020 I decided to focus more on high quality dividend stocks and this is shown nicely in this chart. There are quite a lot of darker green dots and the blue line (current yield) is below the dot (yield on cost). Companies recovered quite nicely after the lows.
At the same time, there a quite a few companies, especially of the mid to low safety score range, which have not recovered and the blue line is above the dot, typically for oil and gas companies and the finance sector.
On the right hand side you can also see the extreme values that stocks can take on. ET and LADR have still a yield on cost of above 10%, even after the dividend cuts. However, one of my goals going forward is not to chase the yield as we can so clearly see that it comes with a lot of risk.
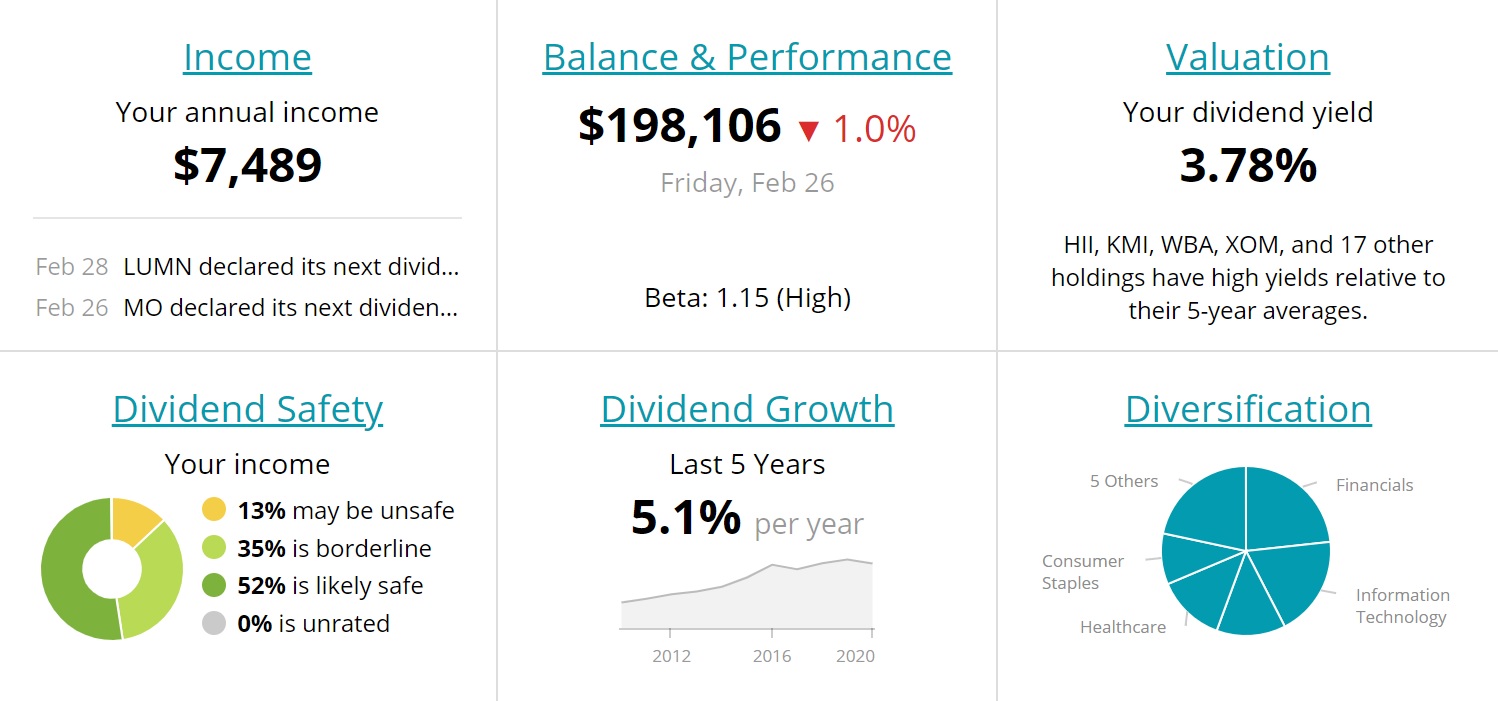
Projected Annual Dividend Income (PADI)
With more money deployed in January my PADI increased accordingly, too. It stands now at $7,489 compared to $7,312 at the end of January. This is a rise of $177 or 2.4%.
My journey continues to invest in high quality dividend growth stocks. However, the stock market shows less and less opportunities. I maintain myself firm to invest in undervalued stocks and this months it was MRK, CAH and HII. At the same time, I try to boost my returns by selling options.
Portfolio Dividend Yield
The current yield of the shares in my portfolio is 3.51%, a decrease of 0.27 compared to last month. A result of another strong month in the stock markets pushing my portfolio value to new record highs.
The investment yield for my dividend growth portfolio is 4.46%, a decrease of 0.03 compared to January. For this yield I compare the current dividend income with the purchase price of the underlying shares.
My yield on cost (YoC) is higher this month at 4.93%, up 0.33%, because of further dividend raises and new option income.
Conclusion
The dividend income for February was $516.53 from 14 different companies, a 35% drop compared to February last year. My PADI stands at $7,489 which marks again a new record. For my target of $8,600 for this year I am right on track.
The dividend safety score of my portfolio is 62.8, an increase of 0.9 points over January but still significantly below my set target of 70 by the end of the year 2021. My analysis has shown that 53% of my dividend income is categorized as safe, but there are still a few stocks with a high risk of being cut.
If you find the information provided helpful and inspiring please consider subscribing to my email list and you will never miss another update. I am also happy to receive comments either on the stocks I hold or other views you want to express. Thank you for having taken the time to read this post.
Disclosure: At time of writing long on all above mentioned
Disclaimer: I am not a professional investment or financial advisor. The information presented on this site represents my personal dividend growth journey and it is for informational purposes only. Opinions expressed are my own and should NOT be relied on or taken as investing advice. I have no knowledge about your personal situation and before you make any investment decision you should exercise due diligence and must do your own research. Always consider seeking advice from a professional financial and tax advisor.