I set as a target 2021 to publish not only my dividend income and dividend growth portfolio evolution but also my options details and profits and losses. Until now I just did not find the time to report this and the tracking was also somewhat missing.
I will show you four aspects of my options trading:
- Cash flow from options trading
Here I will show you the net effect of opening positions which means selling or buying options and the related cash flows. When you sell an option you immediately receive the premium for said option. When you buy an option you pay immediately the premium. Additionally, when you close positions before expiration you buy back sold options and sell bought options. All these are transaction that generate cash flow, either positive or negative.
- Secured Profit / Loss from options trading
When an option expires on a sold option you secure the income as there is no more obligation to either buy (short Put option) or sell (short Call option) the underlying stocks. You have secured this premium for good. At the same time, you can always close positions early before expiration and if the sold put / call option value is lower than when you opened the position you generate a profit. In case it is higher you suffer a loss. In both cases you also sell/buy back the obligation of the contract and there is no risk of getting assigned or shares called away.
- Risk exposure evolution
I tend to sell naked put options which means I do not actually reserve the cash for the underlying option volume. I typically act on margin and have my portfolio value as the collateral. I track my exposure as a percentage of my net portfolio value.
- Transactions and open positions
I will report my transactions and show the status of my open positions.
Rules for Options trading
I have put down a very simple set of rules for my options trading which should help me generate additional income while not taking on too much risk. These rules are:
- Only expose up to 100% of net portfolio value
- Only sell puts of stocks I am actually willing to buy
- Only sell covered calls
There is another important aspect but I would not consider it a rule. Each option trade has to be treated as an individual transaction even though you have the possibility to roll forward an option. However, it is crucial not to chase an option position and not try to compensate for losses on the same stock, maybe it has run out of reach and there are better alternatives.
I failed to meet my rules in 2020 and took on excessive risk just before the market drop in February and March. I suffered substantial losses and identified that I definitely needed to ensure a better risk management.
Options Trading 2020
It has been a hell of a ride in 2020 and going forward I will try to avoid this. Let’s start with the cash flow chart.
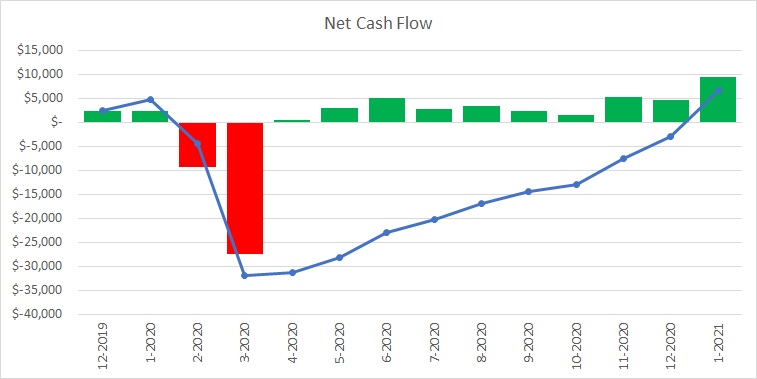
As you can see I opened quite a few positions in December and January and then, as markets dropped in February it all aligned for the perfect storm. Quickly many positions run into negative territory and the margin requirements increased. At the same time the collateral of my owned stocks lost value reducing my margin. Additionally, the volatility increased and led to even higher margin requirements. And it came to what I dreaded the most: Margin Call!
I had to close positions and realize losses. You can clearly see how the two big red bars in the chart show the magnitude. I tried to get out of it as quickly as I could but still hoped for some pull back of the markets to gain time. Nothing of that kind. It was brutal. Was my dividend growth story over before it really started?
No, I drew the line on March 9th and 13th I closed all open positions except 3 which were of extremely low value. My biggest loss came from a sold put option on BLK with a strike price of 510. This trade alone cost me $5,745.
At the same time you can see that I continued to sell puts and tried to pull back. In the chart above it looks like I have recovered the losses in January 2021. Bear in mind that this chart only shows the cash flow. If I sell a call and get paid the premium I have the positive cash flow but the position is still open and may run against me. Until I close it or it expires you do not see the counter transaction which turns this trade into a profit or a loss.
Net profit and loss chart
For this reason it is important to look at the net profit and loss chart. Different to the cash flow chart it captures when you actually realize a gain or loss.

The bars represent the monthly result and the black line the accumulated result. The outcome is quite different from the previous chart and the reason is having still open positions for which I collected premiums.
At the end of 2020 I did a bit of tax optimization and closed positions which were in the profit zone. Others I carried over into 2021.
You can see that in January 2021 I had a very good positive cash flow but a loss on the realized picture. The reason being that in January I closed 2 large positions with a loss and opened quite a few new trades giving me a large cash inflow.
Accumulated I am still in the red with close to $17,000 and try to make ground going forward.
So what went wrong in 2020? How could I lose so much money on options? Clearly I was not fully aware of the risk I was taking on and when the markets went south it hit me full on. In the next chart you can see that I had exposure to more than 300k$ and between 3 to 4 times my actual portfolio value.
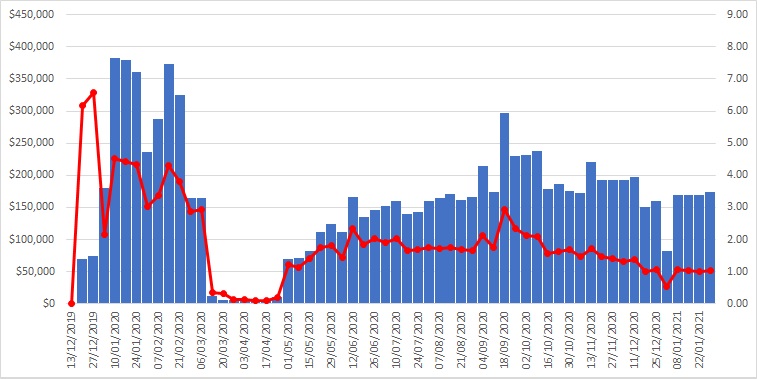
When the markets hit the bottom of the crash in March you can see I had quite a few weeks with almost no exposure but then started to pick up the game and started to open positions in the last week of April. Ever since it has been a good return except for some short call options on DFS.
You can see that the exposure value is now in the range of 150k-200k$ and the portfolio value multiple around the factor one. The spike in September relates to several uncovered call options on TSLA with strikes of 600 to 680 when the stock price was at 405 to 455. Luckily I closed those quickly in September and October. Given Tesla’s current share price I managed to avoid big losses. I do not have a good hand on calls and my learning here is to never trade uncovered calls as the losses are potentially unlimited. I now only have a few open sold calls which are covered by the stocks.
Option Trades in January
In January 2021 I opened several new positions with 32 new contracts. In the table below you can see most of the options are short puts and a few short covered calls. Depending on the underlying I choose a gap to the current price of the underlying close to 10%, but for some more speculative positions or where the volatility is high I tend to go further away, e.g. for the NNDM calls I went 90% over the price of the shares on January, 15th.
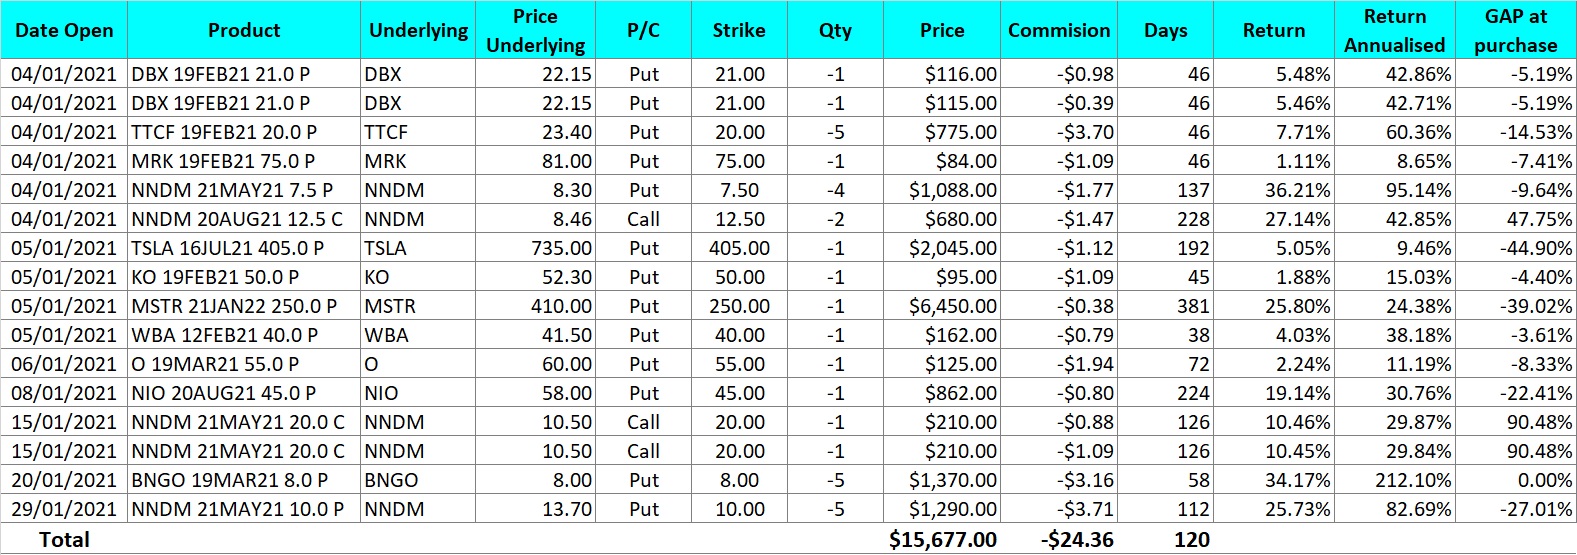
My cash flow for opening positions is $15,677 less $24.36 in commissions. January 2021 was a very intense month and I opened positions on quite a few stocks with high volatility. As such the option premiums are higher.
On the other side I closed 5 positions of which 4 I closed early and one expired worthless for the buyer. I was able to keep the collected premium that I received when selling the option. I had a negative cash flow of $6,136 plus commissions and realized a loss of $5,119.96 out of these positions. You can see that 3 of them were calls on DFS which I sold in September and October of 2020 with a gap of 15% to 27%. Still, all ended up deep in the money. I do not really have a good handle on calls.

As a result, my net cash flow in January was $9,515.06 but I realized a loss of $5,119.96. These are quite extreme opposite values but has to do with my clear-out in December and carrying over some losing positions.
Open positions at the end of January 2021
At the end of January I have 49 open contracts, mostly in short puts. The value is -$19,125.95 with an unrealized gain of $4,166. The exposure not cash secured is of $174,650 equivalent to a factor of 1.05 of my net portfolio value.
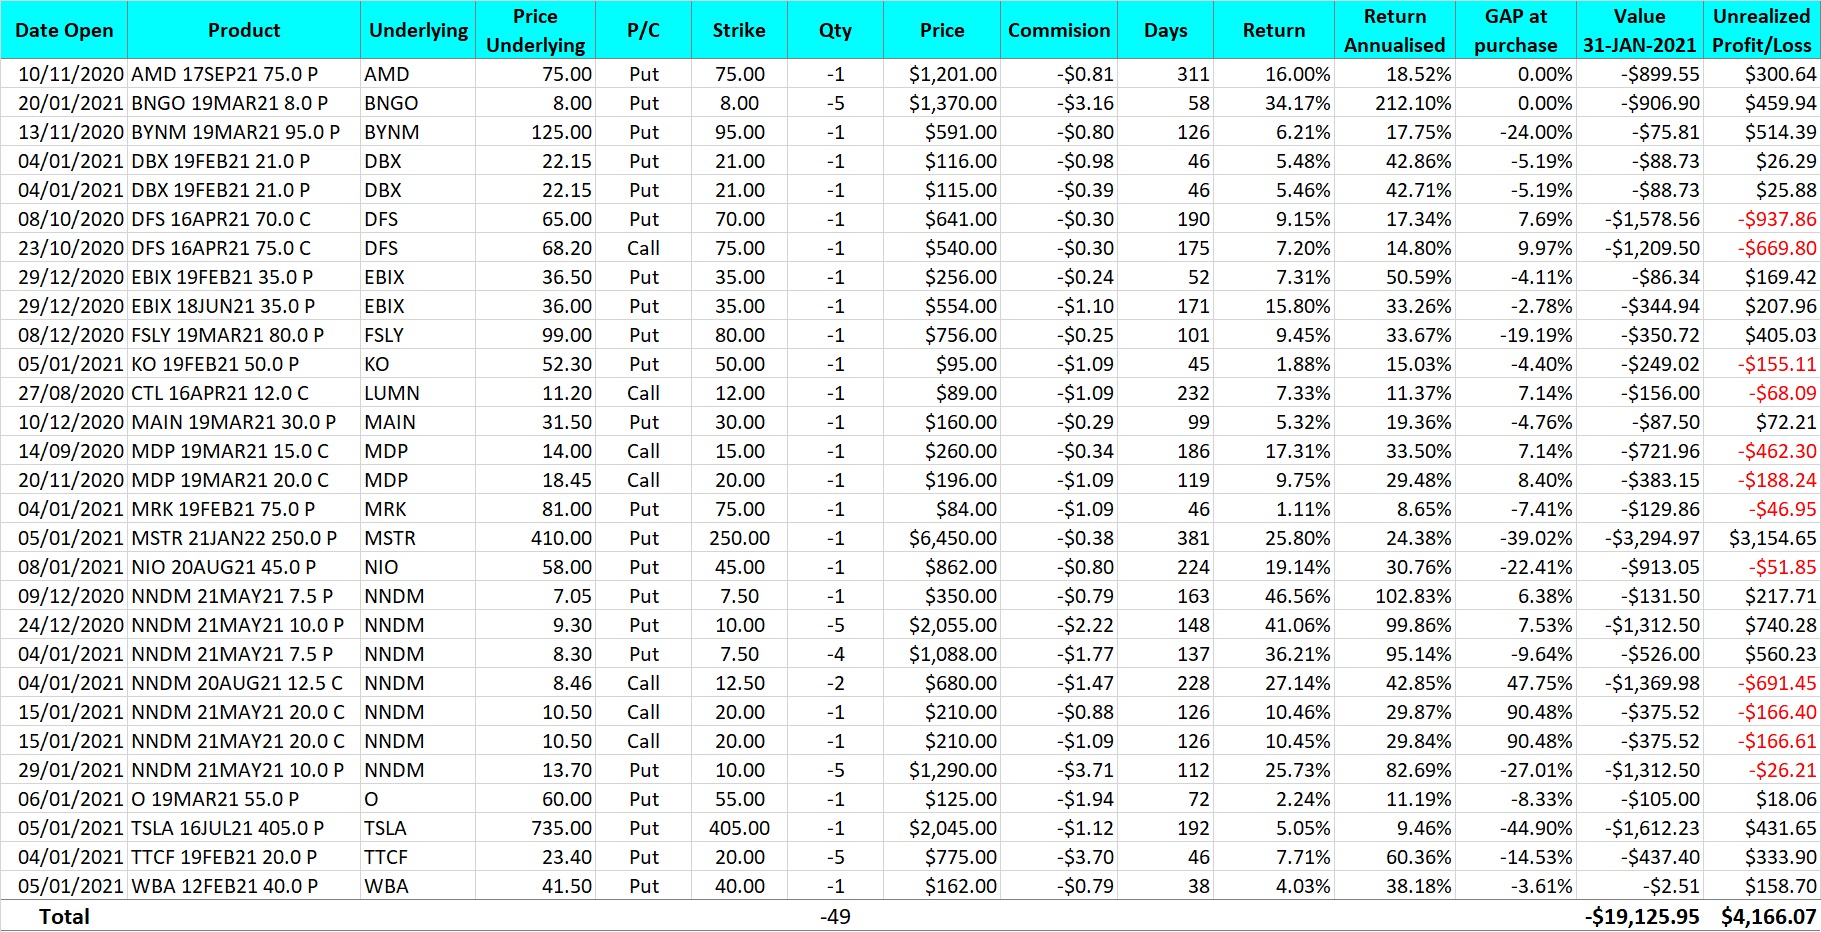
Most of the options have an expiration date between February and May but others are further out, even into 2022 in the case of MSTR.
Conclusion
In 2020 I experienced the downside of options trading when not covered and suffered substantial losses. Ever since, I controlled my risk level better and learned a great deal on what options to trade to get the best trade-off on premium vs exposure. The recovery in the second half of 2020 was good but I am as of January 2021 still accumulating a loss of close to $17,000 out of options trading.
I currently have 49 contracts open with a value of -$19,125 and an unrealized profit of $4,166 on these. The exposure value is $174,650 or 1.05 times my net portfolio value.
Disclaimer: I am not a professional investment or financial advisor. The information presented on this site represents my personal dividend growth journey and it is for informational purposes only. Opinions expressed are my own and should NOT be relied on or taken as investing advice. I have no knowledge about your personal situation and before you make any investment decision you should exercise due diligence and must do your own research. Always consider seeking advice from a professional financial and tax advisor.