Yet another month has gone by and it is time to review my dividend income. August is month in which I receive dividends from fewer companies while at the same time a large proportion of my passive income is concentrated in just a few of them. Last month was special as I hit the $500 mark, August was not bad either. I received exactly $469.41 in dividends.
The pandemic around Covid-19 has made me take a step back and to really assess my portfolio. I already established that high quality dividend growth stocks are the central part of my investment strategy. What was still missing is a case by case analysis – how safe is the dividend given the market situation? Am I still chasing the yield over quality and safety in the long run?
I also started to push myself into adding more technology stocks into my portfolio. I know the valuations are extremely high and it might blow right back in my face. At the same time, companies like Microsoft have consistently been overvalued and I consider that internet based, cloud and other services still have a long way to go and grow profits for the main players. For this reason, since June 2020 I spread a bit of money over some ot the technology companies that are the strongest in their respective fields. This accounts for about 6% of my total investment portfolio. As these companies do not pay dividends or, in case they do the yield is very low, I have excluded them from my dividend portfolio and consider this a sub-portfolio of Technology Stock Portfolio.
Dividend Income August
Last month I received dividends from 12 different companies. Even though I am not targeting to have an equal split of receiving dividends each month, the passive income is close to the $500 mark for each single month. During the month of August I received $469.41 in dividends:
Abbvie (ABBV) – income of $59.00
Energy Transfer LP (ET) – income of $61.00
Gladstone Investment Corp (GAIN) – income of $7.00
General Dynamics (GD) – income of $27.50
General Mills (GIS) – income of $14.70
Gladstone Commercial Corp (GOOD) – income of $12.52
Kinder Morgan (KIM) – income of $13.13
Realty (O) – income of $14.01
Omega Healthcare (OHI) – income of $20.10
Starbucks (SBUX) – income of $8.20
Tanger Factory Outlet Centers (SKT) – income of $0.00
AT&T (T) – income of $104.00
Unum Group (UNM) – income of $128.25
There is quite some concentation on T and UNM representing $232.25 or 49.5% of this month’ income. No new first time contributors in August. All companies are at least 3 months in my dividend growth portfolio. The additional purchases of GD, T and UNM had the biggest impact compared to May and SKT has suspended its dividend.
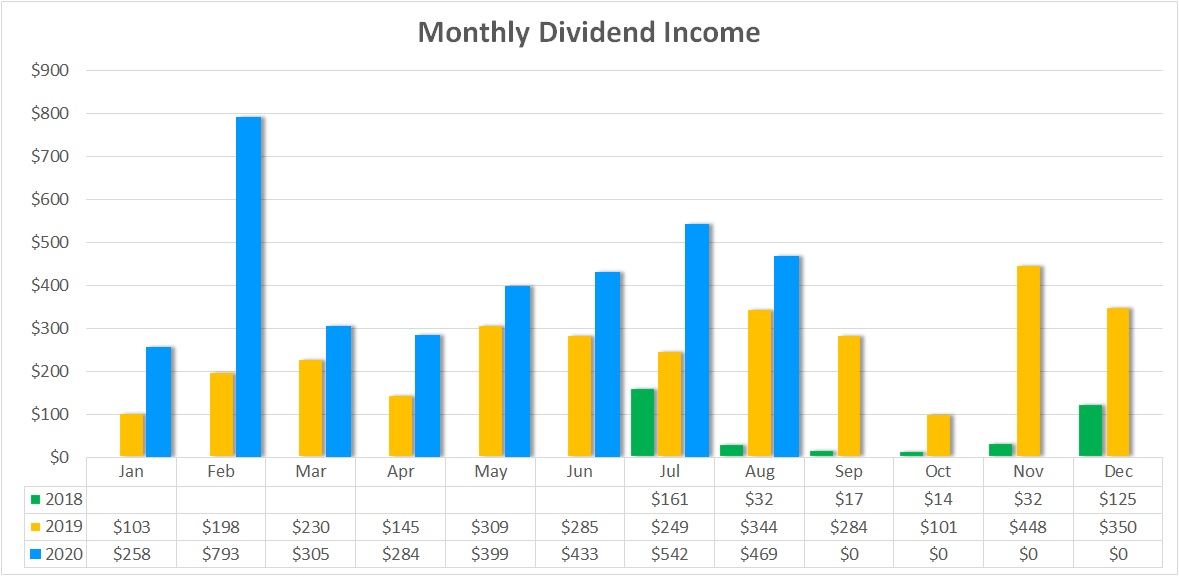
The following chart shows my monthly dividend income over time. In August 2020 I received $469.41 compared to July 2019 with $344.27 of income. This is an increase of $125.14 or 36%. On a year-to-date basis, from January to August I increased my dividend income from $1,862.91 in 2019 to $3,482.20 in 2020, an increase of $1,619.29 or 87%. This significant increase is mostly due to my contributions this year. I am really pushing it to get a head start.
Dividend Changes
In August there have been neither dividend increases nor cuts for the stocks in my portfolio. As the dividend growth is an integral part of my dividend investment strategy this will have a long-term negative impact on the compounding. At the same time, I understand that each company needs to evaluate carefully its commitment to its shareholders while also ensuring the safe and sound financing for the future business.
Expected Dividend Increases for September
The following companies in my dividend growth portfolio have raised their dividend last year:
Lockheed Martin Corporation (LMT) – a 5% raise expected, even though the 5-year growth rate has been more than 10% I do not expect such an increase for this year
Portfolio Split into Dividend Growth Stocks and Technology Stocks
As mentioned in my introduction of this post I also started to push myself into adding more technology stocks into my portfolio. For this reason I split my portfolio into two sub-portfolios: one for dividend growth stocks and one for technology growth stocks.
As such for the technology growth portfolio I have started to invest into the following stocks:
- Apple (AAPL)
- Amazon (AMZN)
- Alibaba (BABA)
- Facebook (FB)
- Alphabet (GOOGL)
- Mastercard (MA)
- Microsoft (MSFT)
- Netflix (NFLX)
- Nvidia (NVDA)
- Tesla (TSLA)
- Visa (V)
The reason for this move is to have a certain exposure to what I consider key players for the ever growing technology and digital world as services of this kind will be more embedded into both our professional and private life.
Currently I hold about $7k in my portfolio in these stocks representing about 6% of my overall portfolio. Companies like Nvidia and Visa I already held for longer during this year but moved them over to this sub-portfolio. Other technology stocks remain in the dividend growth portfolio as my focus is to grow the passive income, e.g. IBM or Cisco.
My main concern is the extremely high valuation of basically every single stock in the Technology Stock Portfolio. Just looking at some of the FAST Graphs charts tells me that I might be too late in this and future performance will be much lower than the recent past.
Sorted by P/E ratio in order from highest to lowest:
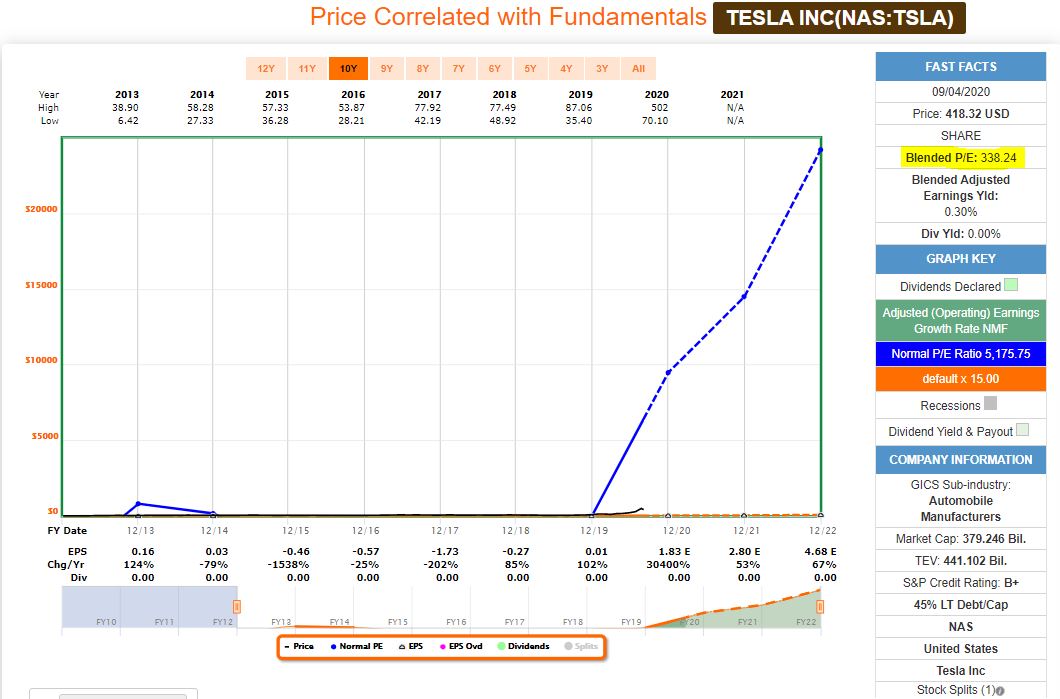
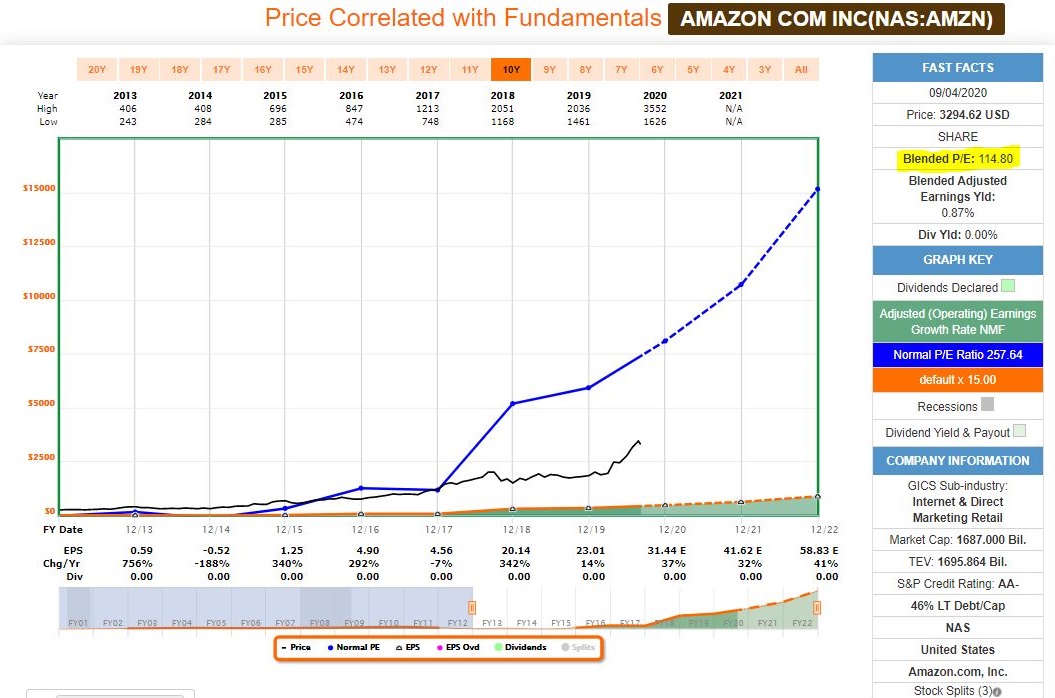
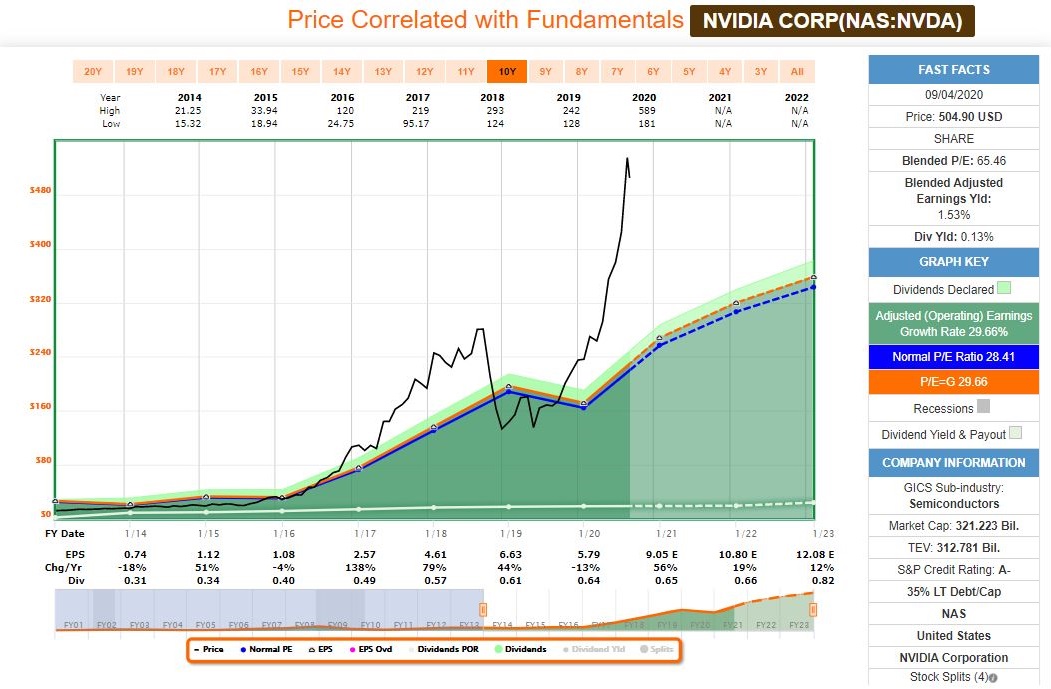
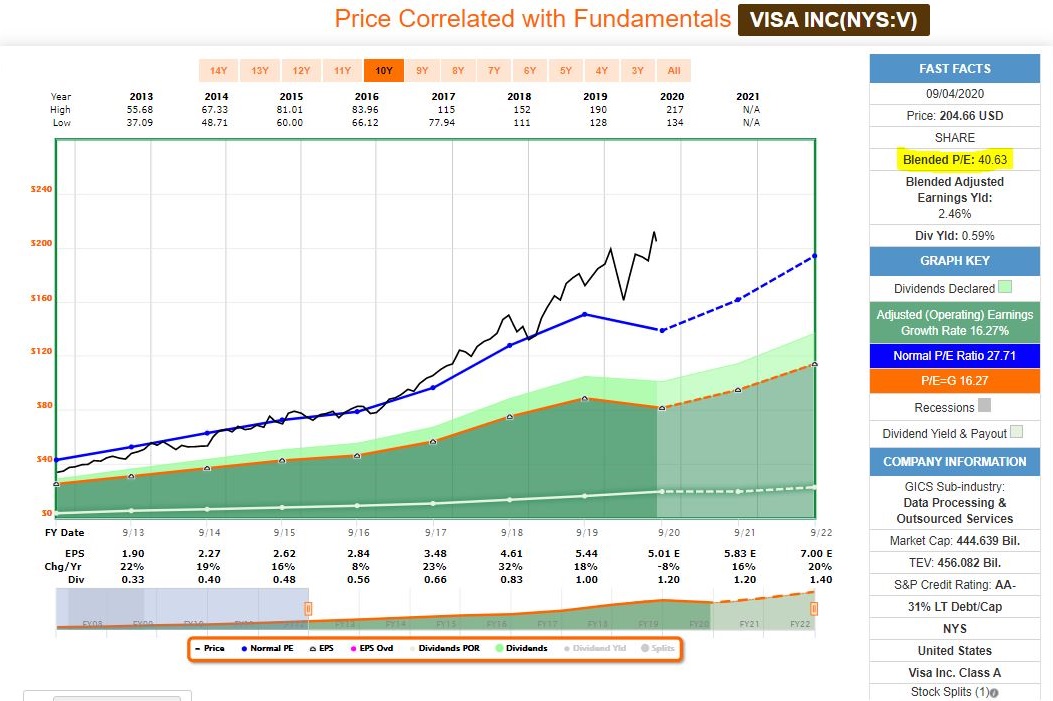
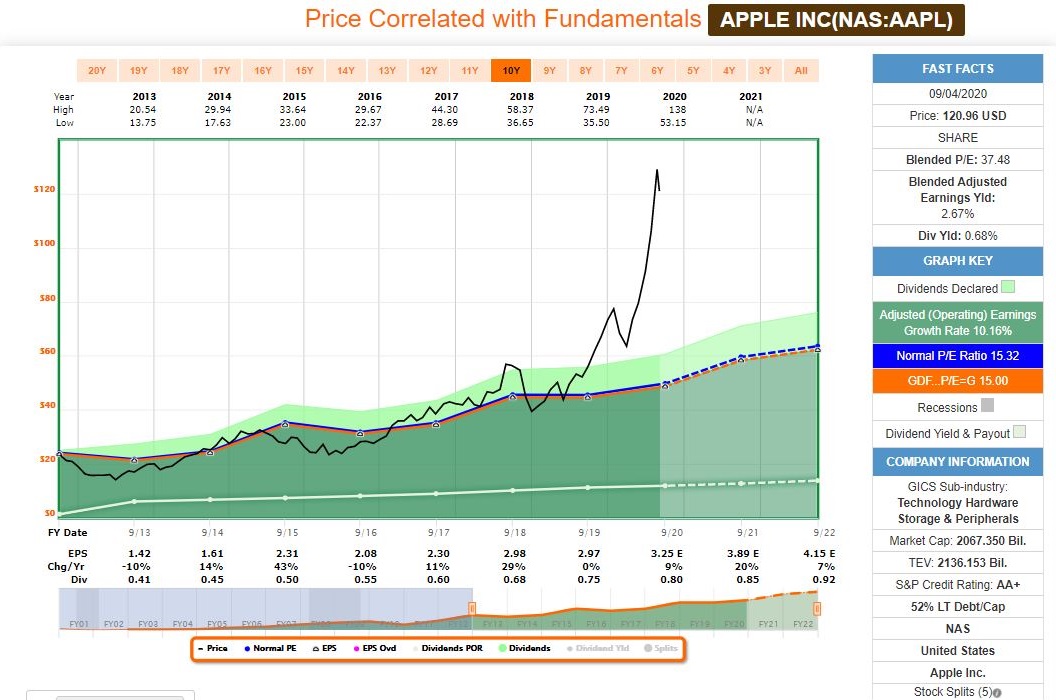
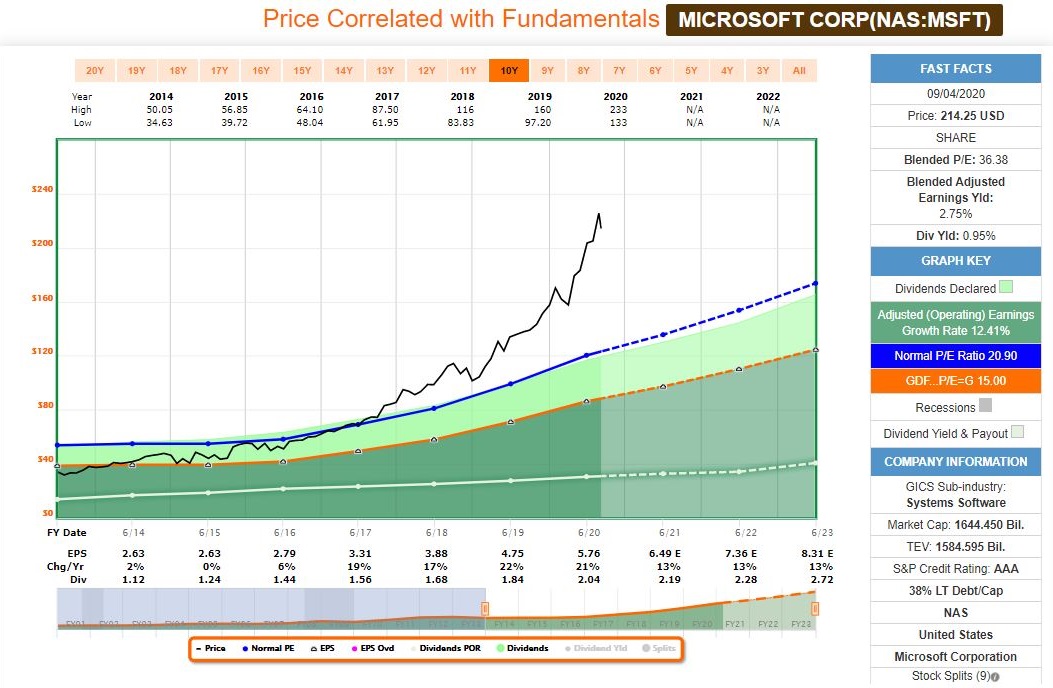
These are just six companies but the story is always the same. Over the last year I learned to identify undervalued stocks based on their future return expectations. Clearly, all these stocks seems overvalued and may reverse to the mean at some point.
As an example, if we look at Microsoft, the current P/E of 36 is 3 times higher than just 8-10 years ago when it was moving around 10-12. The normal P/E of the last 8 years was 21. If the stock price reverts to that it will drop by about $80 or 30%. I know that with the new subscription model and the cloud based business there is a lot of growth priced in, but this is already accounted for by analysts, too.
The Dividend Growth Portfolio
In the Dividend Growth Portfolio I hold 45 different companies. Here is an overview of the status.
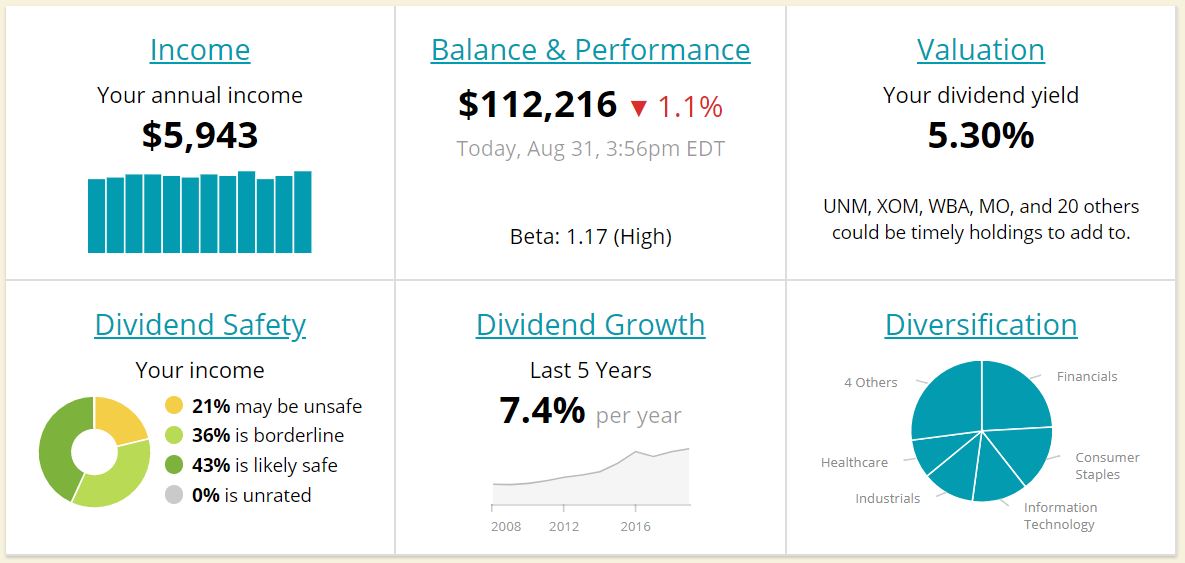
Projected Annual Dividend Income (PADI)
As you can see my PADI stands at $5,943 as per SSD summary. However, I also still hold a European company Endesa SA (BME:ELE) which pays about 96$ in annual dividends (depending on the exchange rate). Hence, in total my PADI for the Dividend Growth Portfolio is $6,039 looking forward.
This is an increase of $105 or 1.8% over last month when my PADI stood at $5,934.
Purchases
I added three new stocks to my portfolio which I consider undervalued and with both dividend growth and value appreciation potential. All three are in the technology sector and have a low dividend payout ratio.
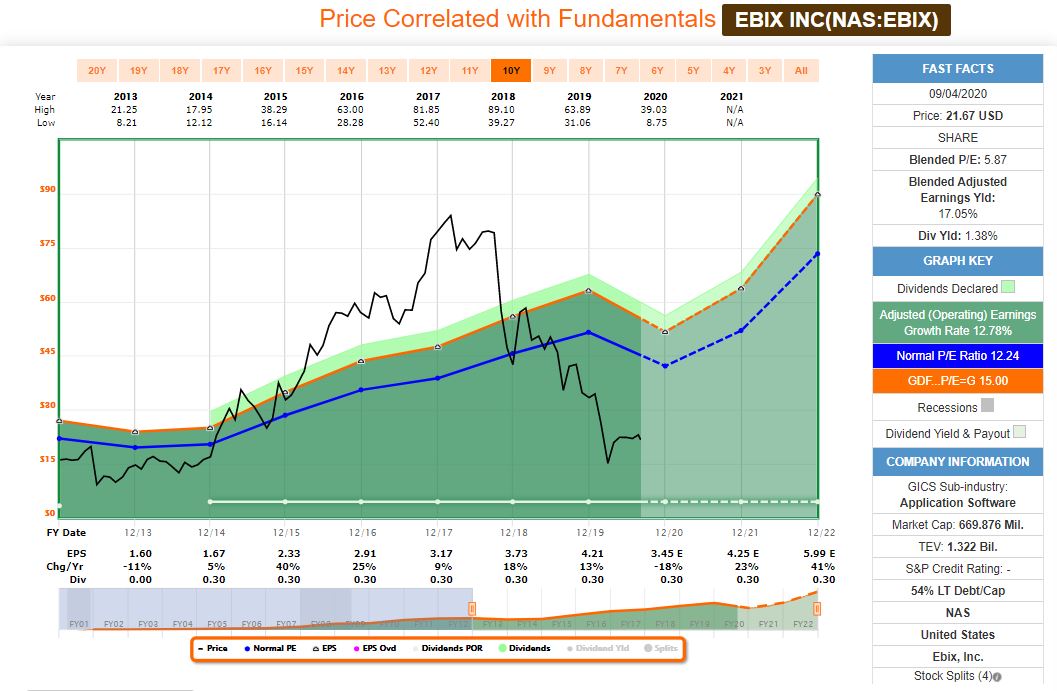
Purchase #1: Ebix Inc. (ticker: EBIX)
Ebix Inc is a provider of enterprise cloud e-commerce solutions for the insurance, finance, and healthcare industries. The firm generates most of its revenue from data exchanges in life insurance, annuities, health benefits, risk management, and workers’ compensation. These exchanges connect multiple entities within the insurance and healthcare markets, enabling participants to carry and process data from one entity to another. The company derives revenue from subscriptions and transaction fees for its services. Ebix generates the majority of its revenue in the United States, but it has a presence in Latin American, European, and Asia-Pacific regions.
Number of shares: 40
Average cost: $25.74
Annual dividend: $12.00
Dividend yield: 1.17%
5-year DGR: 0.00%
EPS Forward: $3.31
P/E: 7.78
Payout Ratio: 9%
Dividend Safety Score: Not rated
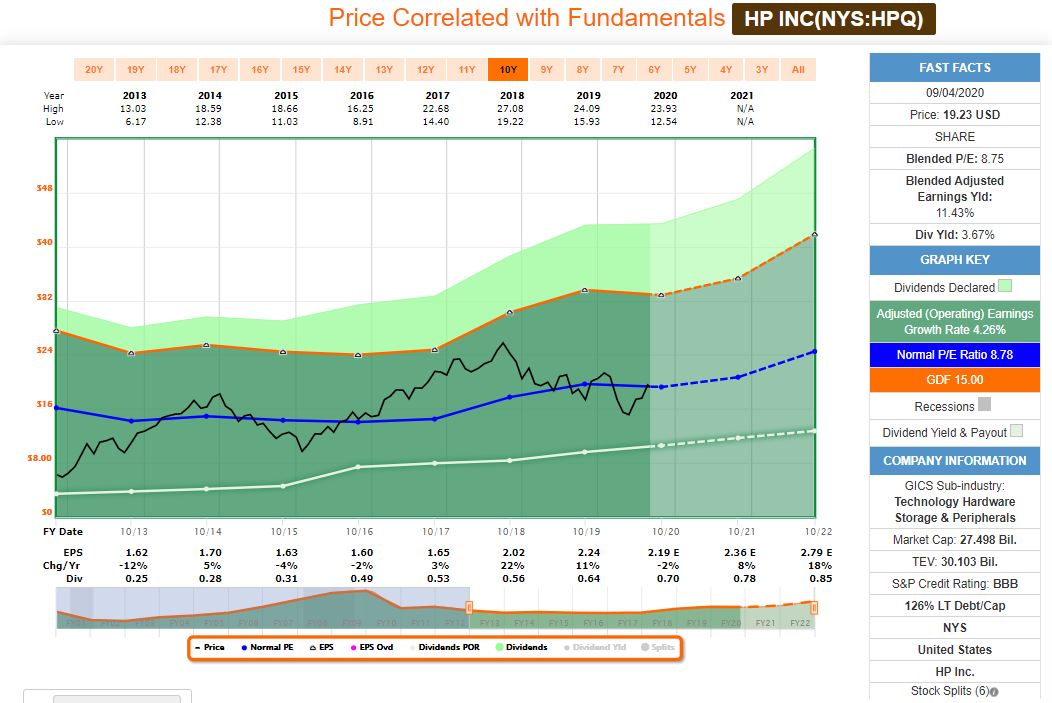
Purchase #2: HP Inc. (ticker: HPQ)
HP Inc. is a leading provider of computers, printers, and printer supplies. The company’s two operating business segments are its personal systems, containing notebooks, desktops, and workstations and its printing segment which contains supplies, consumer hardware, and commercial hardware. In 2015, Hewlett-Packard was separated into HP Inc. and Hewlett Packard Enterprise. The Palo Alto, California based company sells on a global scale with 63% of fiscal 2017 revenue derived from outside the United States.
Number of shares: 50
Average cost: $18.16
Annual dividend: $35.24
Dividend yield: 3.88%
5-year DGR: 18.28%
EPS Forward: $2.19
P/E: 8.29
Payout Ratio: 32%
Dividend Safety Score: 74
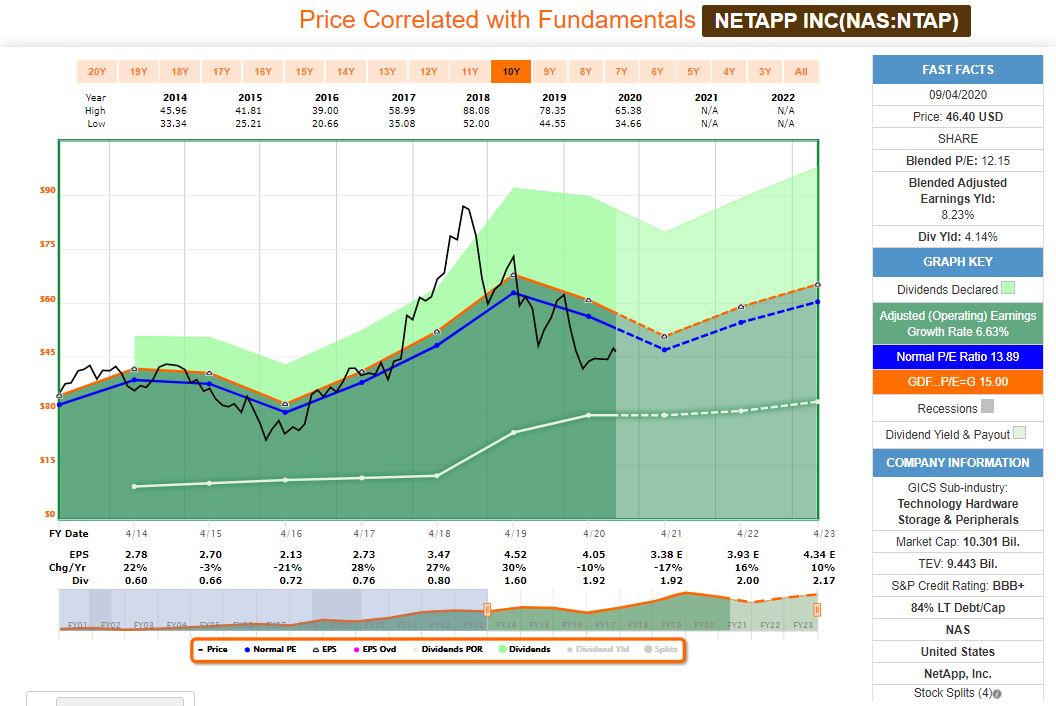
Purchase #3: NetApp Inc. (ticker: NTAP)
NetApp is a leading provider of enterprise data management and storage solutions. The company’s three operating business units are products, software maintenance, and hardware maintenance. NetApp transitioned from a data center storage firm to a company with software data management solutions for multicloud environments. The California-headquartered company sells globally and has approximately 10,000 employees.
Number of shares: 25
Average cost: $41.41
Annual dividend: $48.00
Dividend yield: 4.64%
5-year DGR: 22.81%
EPS Forward: $3.40
P/E: 12.18
Payout Ratio: 56%
Dividend Safety Score: 70
I contributed a higher than normal amount to my dividend growth portfolio in August and was able to reduce my debt on margin quite significantly. Even though I did not plan to add any more shares to the portfolio this year, if there are opportunities I believe that the low interest environment allows me to take on debt for the moment. In the long run I plan to use this only in case of market crashes to be able to invest heavily when prices are down.
Two lessons to be learned here:
First, even though the general market is overvalued, there are always opportunities of undervalued stocks. It’s a market of stocks and not a stock market.
Second, assuming that markets are overvalued and a market correction is more likely to occur, I need to clean up my balance sheet – reduce my debt on margin – to be able to have this margin volume available if I want to get heavily in on those punished stocks that become undervalued.
I now consider that I need to just pour in money to pay off the margin on which I am building this. I still have a few put options on stocks which I would be willing to buy if the share price falls below the strike price at maturity. However, there are very few candidates and it is very unlikely. Hence, for the rest of the year there should be no more additions.
Portfolio Dividend Yield
The investment yield for my dividend growth portfolio is 5.3%, up 0.1%. For this I compare the current dividend income with the purchase price of the underlying shares. My yield on cost (YoC) is lower at 4.6%, the same as the month before, because of losses taken from options which also required additional funding without adding new dividend income. The current yield of the shares in my portfolio is 5.3%, up 0.1% from July.
Dividend Safety
One of the key metrics for my future passive income is how safe it is. For this reason I have started to track my Dividend Safety Score. For this score I use the weighted dividend safety punctuation from Simply Save Dividends combined with the dividend income of each of my stocks. For August, the Dividend Safety Score is 57.7 for my dividend growth portfolio.
I consider this score somewhat at the lower acceptable end and my target is a score of 70. I want to have achieved this by the end of next year. My plan is not to sell low rated stocks and re-balance to high scoring ones. This should only be the exception.
I rather plan to continuously add to my portfolio and here really focus on quality. The re-balancing happens over time as new money deployed lowers the proportion of the low scoring stocks. I have seen that this works just fine at other dividend growth investor portfolios.
Dividend Safety Score
As mentioned above the weighted dividend safety score of my portfolio is 57.7 based on the rating and dividend income from each individual stock in my portfolio.
Let’s look at the actual distribution. I use the same classification as Simply Safe Dividends as it makes it easy to spot the categories.
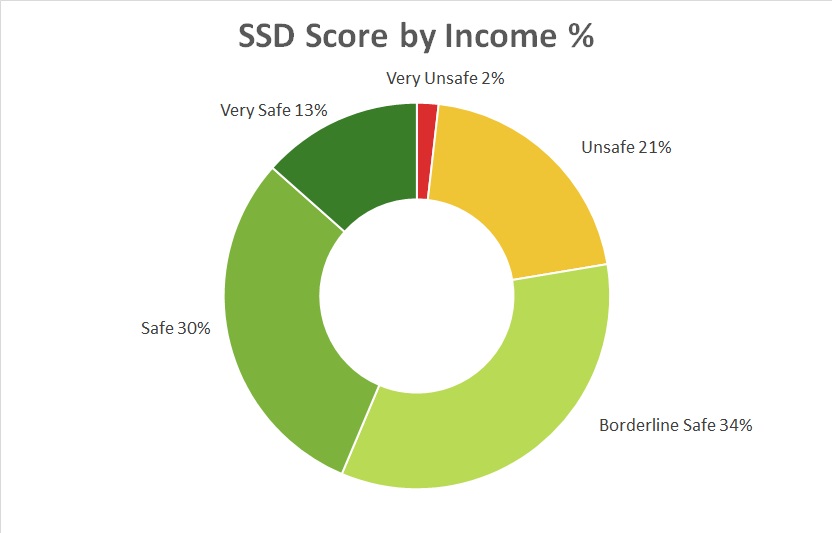
As you probably know the different classes are and related score are:
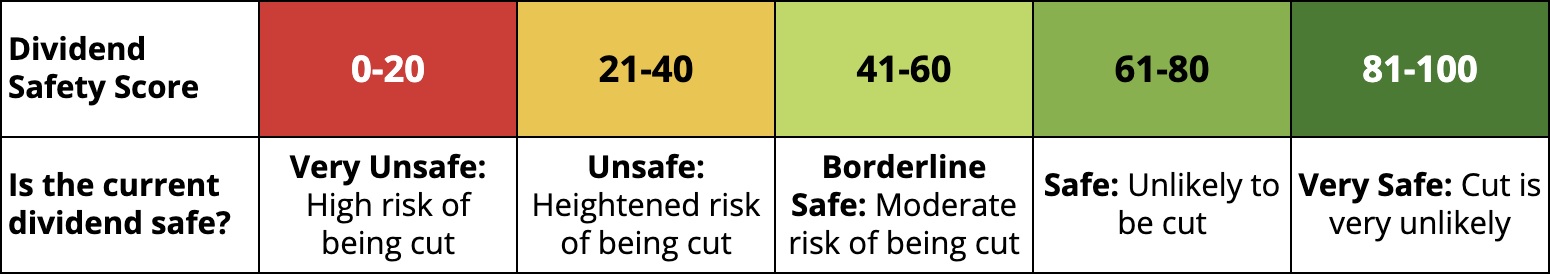
In my portfolio 53% is in the Safe and Very Safe category which has very little risk of being cut. Another 34% is Borderline Safe. The remaining 23% are Unsafe or Very Unsafe. This worries me a bit and I need to monitor these positions closely. A cut by 50% on these stocks means that my PADI will drop by about $700. This is already quite some risk.
For each individual stock in my portfolio the current score is as follows:
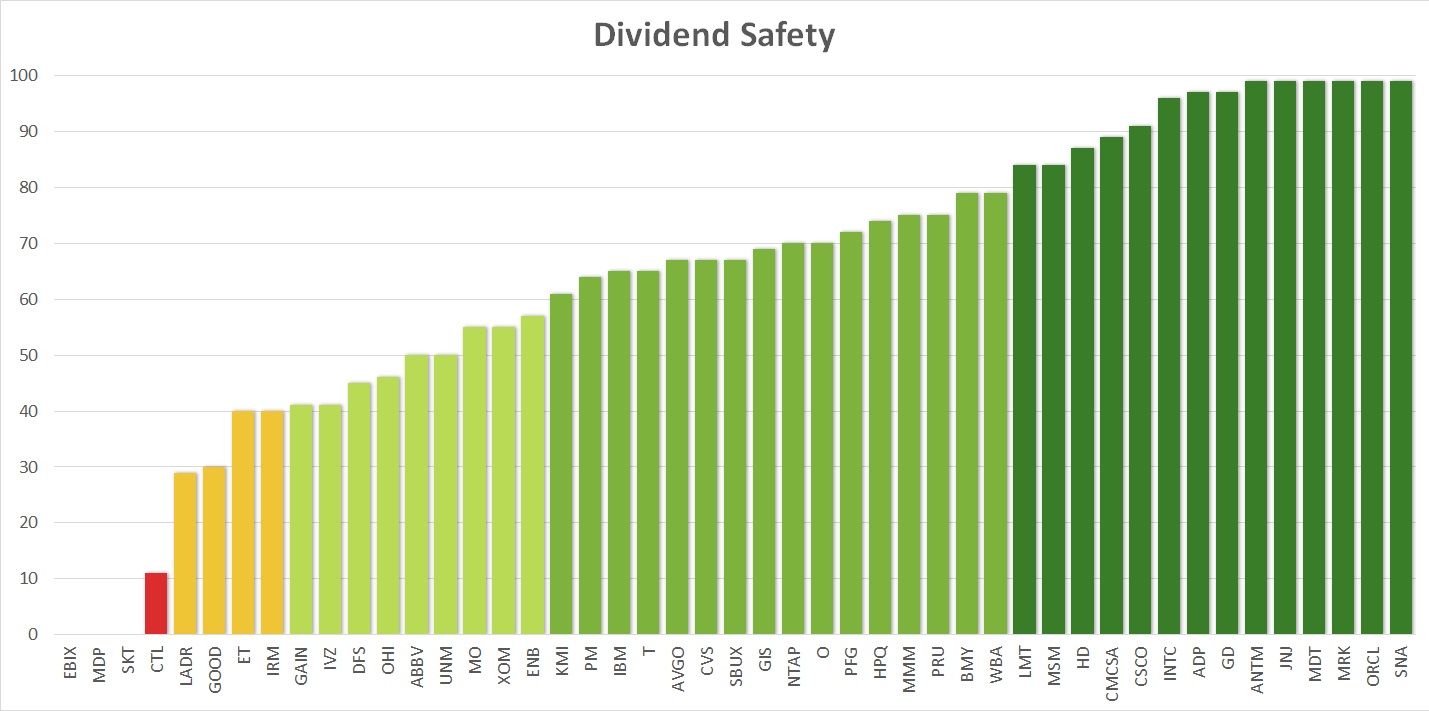
I hold 14 companies in the highest category and another 16 companies is the second highest category. Overall, my portfolio contains many high quality dividend stocks with a safe dividend score.
On the other end we see the red alarming light wit CTL. Luckily this is only a small position and I have also a sold option which boosts the return. I am not concerned about this one.
I am, however, very closely monitoring LADR as it is my largest position for dividend income, and this after their 50% dividend cut. A further cut may hurt my performance significantly. GOOD and ET are also smaller positions and not require any further attention. The score for IRM surprises me as I consider the business model valid and the payout for a REIT is acceptable. I will have to monitor closely if there are any negative signs.
Another way of looking at the dividend safety is by yield and score. For each of my holdings I compare these values to visualize the figures which clearly lets you draw some general conclusions.
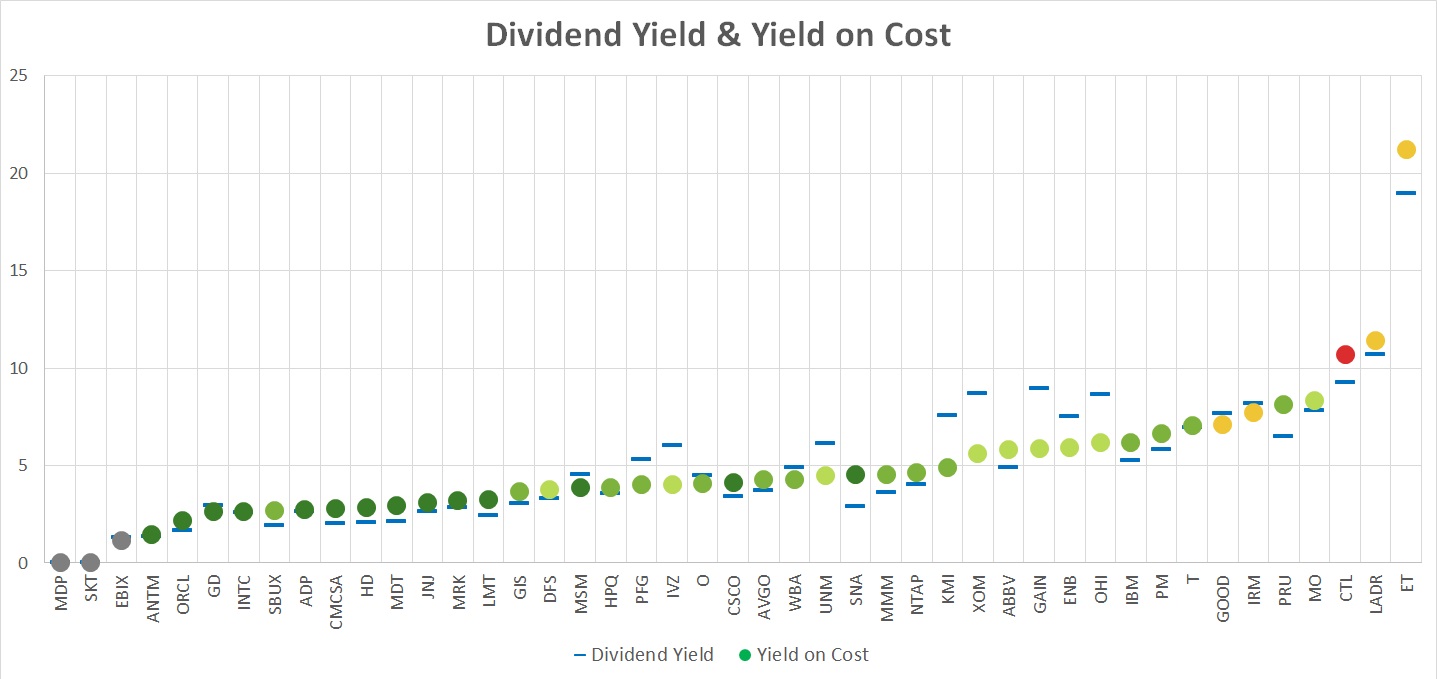
The dots represent my yield on cost with the color of the dividend safety score. The blue lines indicate the current yield of these stocks. The grey dots represent companies that either do not pay a dividend or are not covered by SSD.
There is a clear correlation between yield and safety score. On the left hand side (apart from the grey dots) we have the low yield, high safety score companies. The further we go to the right, the lower the dividend safety score becomes but it typically comes with a higher yield.
In the midst of the market crash in March I decided to focus more on high quality dividend stocks and this is shown nicely in this chart. There are quite a lot of darker green dots and the blue line (current yield) is below the dot (yield on cost). Companies recovered quite nicely after the low.
At the same time, there a quite a few companies, especially of the mid to low safety score, which have not recovered and the blue line is above the dot, typically for oil and gas companies and the finance sector.
On the right hand side you can also see the extreme values that stocks can take on. ET has a yield on cost of above 20%. Others also above 10%. However, one of my goals going forward is not to chase the yield as we can so clearly see that it comes with a lot of risk.
Conclusion
The dividend income for August was $469.41 from 12 different companies, a 36% increase over August last year. My PADI stands at $6,039 which marks both a new record and having hit another milestone by surpassing the $6.000 or $500 per month mark. My original target for this year of $5,000 was already reached in June.
The dividend safety score of my portfolio is 57.7, significantly below my recently set target of 70. My analysis has shown that 53% of my dividend income is safe but there are a few stocks with are at risk of being cut.
Disclosure: At time of writing long on all above mentioned stocks
Disclaimer: I am not a professional investment or financial advisor. The information presented on this site represents my personal dividend growth journey and it is for informational purposes only. Opinions expressed are my own and should NOT be relied on or taken as investing advice. I have no knowledge about your personal situation and before you make any investment decision you should exercise due diligence and must do your own research. Always consider seeking advice from a professional financial and tax advisor.
I was personally very interested in reading your article. And the main thing is your argumentation. I came to dividing my portfolio into growth stocks and high-quality dividend stocks at the end of 2019. This is the right decision as the growth rate of the tech sector is high. If we don’t do this, we will simply miss out on profits. As for dividend stocks, you can buy them later, if you increase your capital))
Thanks for the interesting materials!
Thanks for your comment. My main goal is to build a solid, dividend growth portfolio. I tend to look for undervalued stocks so that my total return is even higher than the dividend income. In a way, I try to get the best of both worlds.
This was agreat, detaield read DGJ. It is insane that your dividned portfolio’s yield is over 5%. However, given your large investments in AT&T, it isn’t that surprising. While they make up a large percentage of your August income now, I wouldn’t be too concerned. Over time, as you add more positions, that percentage will decrease. Build large and start filling out the rest of your portfolio.
Keep up the great work.
Bert
Thanks for your feedback Bert. My portfolio is still somewhat in the early stages and I have some stocks with a higher weight, both in value and/or dividend income. My current limit is max 10% for any given stock on value or dividend income. After my dividend safety analysis these high weighted stock will progressively go down as I will invest more and more into high quality stocks and these do have room to increase their weight in my portfolio. For the next 2-3 years a 5% max level is probably more reasonable.